Mongolian vs Immigrants from Uganda Seniors Poverty Over the Age of 65
COMPARE
Mongolian
Immigrants from Uganda
Seniors Poverty Over the Age of 65
Seniors Poverty Over the Age of 65 Comparison
Mongolians
Immigrants from Uganda
10.9%
SENIORS POVERTY OVER THE AGE OF 65
58.0/ 100
METRIC RATING
168th/ 347
METRIC RANK
11.1%
SENIORS POVERTY OVER THE AGE OF 65
32.2/ 100
METRIC RATING
191st/ 347
METRIC RANK
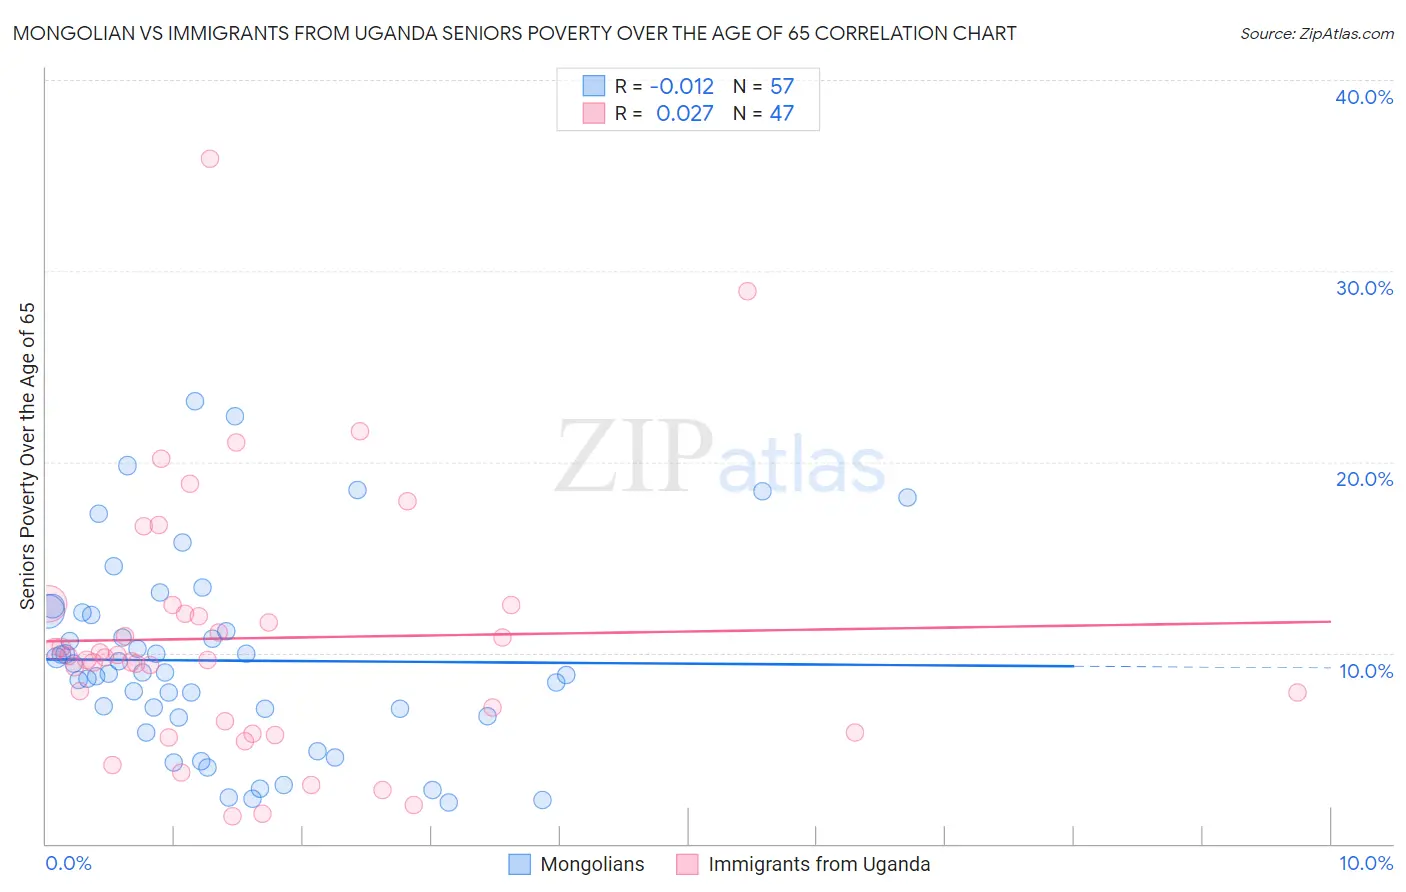
Mongolian vs Immigrants from Uganda Seniors Poverty Over the Age of 65 Correlation Chart
The statistical analysis conducted on geographies consisting of 140,162,165 people shows no correlation between the proportion of Mongolians and poverty level among seniors over the age of 65 in the United States with a correlation coefficient (R) of -0.012 and weighted average of 10.9%. Similarly, the statistical analysis conducted on geographies consisting of 125,911,000 people shows no correlation between the proportion of Immigrants from Uganda and poverty level among seniors over the age of 65 in the United States with a correlation coefficient (R) of 0.027 and weighted average of 11.1%, a difference of 2.4%.
Seniors Poverty Over the Age of 65 Correlation Summary
| Measurement | Mongolian | Immigrants from Uganda |
| Minimum | 2.2% | 1.4% |
| Maximum | 23.2% | 35.9% |
| Range | 21.0% | 34.5% |
| Mean | 9.6% | 10.8% |
| Median | 8.9% | 9.7% |
| Interquartile 25% (IQ1) | 6.7% | 5.8% |
| Interquartile 75% (IQ3) | 12.1% | 12.5% |
| Interquartile Range (IQR) | 5.4% | 6.7% |
| Standard Deviation (Sample) | 5.0% | 6.8% |
| Standard Deviation (Population) | 5.0% | 6.7% |
Similar Demographics by Seniors Poverty Over the Age of 65
Demographics Similar to Mongolians by Seniors Poverty Over the Age of 65
In terms of seniors poverty over the age of 65, the demographic groups most similar to Mongolians are Sri Lankan (10.9%, a difference of 0.10%), Immigrants from Eastern Europe (10.9%, a difference of 0.20%), Alaska Native (10.8%, a difference of 0.22%), Nonimmigrants (10.9%, a difference of 0.26%), and Immigrants from Syria (10.9%, a difference of 0.30%).
| Demographics | Rating | Rank | Seniors Poverty Over the Age of 65 |
| Arabs | 65.2 /100 | #161 | Good 10.8% |
| Immigrants | Indonesia | 64.8 /100 | #162 | Good 10.8% |
| Tsimshian | 64.5 /100 | #163 | Good 10.8% |
| Potawatomi | 62.6 /100 | #164 | Good 10.8% |
| Immigrants | South Eastern Asia | 62.1 /100 | #165 | Good 10.8% |
| Malaysians | 62.0 /100 | #166 | Good 10.8% |
| Alaska Natives | 60.3 /100 | #167 | Good 10.8% |
| Mongolians | 58.0 /100 | #168 | Average 10.9% |
| Sri Lankans | 56.8 /100 | #169 | Average 10.9% |
| Immigrants | Eastern Europe | 55.8 /100 | #170 | Average 10.9% |
| Immigrants | Nonimmigrants | 55.1 /100 | #171 | Average 10.9% |
| Immigrants | Syria | 54.7 /100 | #172 | Average 10.9% |
| Spaniards | 50.7 /100 | #173 | Average 10.9% |
| Immigrants | Sudan | 50.0 /100 | #174 | Average 10.9% |
| Creek | 49.6 /100 | #175 | Average 10.9% |
Demographics Similar to Immigrants from Uganda by Seniors Poverty Over the Age of 65
In terms of seniors poverty over the age of 65, the demographic groups most similar to Immigrants from Uganda are Indian (Asian) (11.1%, a difference of 0.20%), Immigrants from Southern Europe (11.1%, a difference of 0.22%), Taiwanese (11.2%, a difference of 0.30%), Immigrants from Laos (11.1%, a difference of 0.34%), and Immigrants from Hong Kong (11.1%, a difference of 0.40%).
| Demographics | Rating | Rank | Seniors Poverty Over the Age of 65 |
| Immigrants | France | 40.9 /100 | #184 | Average 11.0% |
| Immigrants | Lebanon | 38.2 /100 | #185 | Fair 11.1% |
| Immigrants | Eastern Asia | 37.5 /100 | #186 | Fair 11.1% |
| Immigrants | Middle Africa | 37.4 /100 | #187 | Fair 11.1% |
| Immigrants | Hong Kong | 36.3 /100 | #188 | Fair 11.1% |
| Immigrants | Laos | 35.7 /100 | #189 | Fair 11.1% |
| Indians (Asian) | 34.2 /100 | #190 | Fair 11.1% |
| Immigrants | Uganda | 32.2 /100 | #191 | Fair 11.1% |
| Immigrants | Southern Europe | 30.1 /100 | #192 | Fair 11.1% |
| Taiwanese | 29.2 /100 | #193 | Fair 11.2% |
| Chileans | 27.8 /100 | #194 | Fair 11.2% |
| Immigrants | Vietnam | 26.6 /100 | #195 | Fair 11.2% |
| Bangladeshis | 25.2 /100 | #196 | Fair 11.2% |
| Albanians | 24.4 /100 | #197 | Fair 11.2% |
| Immigrants | Burma/Myanmar | 21.3 /100 | #198 | Fair 11.3% |