Mongolian vs Czechoslovakian Seniors Poverty Over the Age of 65
COMPARE
Mongolian
Czechoslovakian
Seniors Poverty Over the Age of 65
Seniors Poverty Over the Age of 65 Comparison
Mongolians
Czechoslovakians
10.9%
SENIORS POVERTY OVER THE AGE OF 65
58.0/ 100
METRIC RATING
168th/ 347
METRIC RANK
9.5%
SENIORS POVERTY OVER THE AGE OF 65
99.8/ 100
METRIC RATING
36th/ 347
METRIC RANK
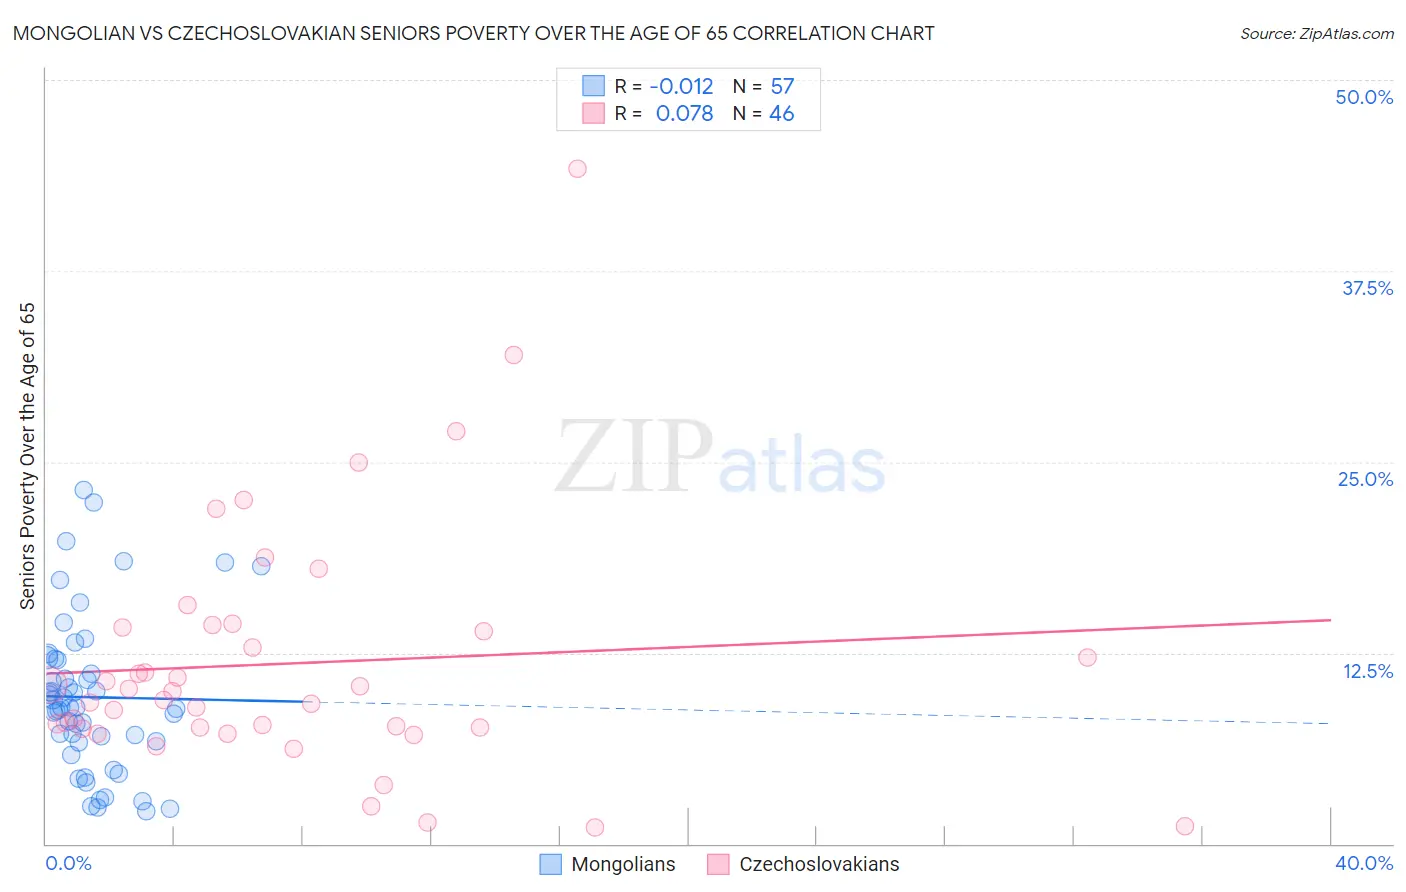
Mongolian vs Czechoslovakian Seniors Poverty Over the Age of 65 Correlation Chart
The statistical analysis conducted on geographies consisting of 140,162,165 people shows no correlation between the proportion of Mongolians and poverty level among seniors over the age of 65 in the United States with a correlation coefficient (R) of -0.012 and weighted average of 10.9%. Similarly, the statistical analysis conducted on geographies consisting of 367,521,017 people shows a slight positive correlation between the proportion of Czechoslovakians and poverty level among seniors over the age of 65 in the United States with a correlation coefficient (R) of 0.078 and weighted average of 9.5%, a difference of 14.8%.
Seniors Poverty Over the Age of 65 Correlation Summary
| Measurement | Mongolian | Czechoslovakian |
| Minimum | 2.2% | 1.1% |
| Maximum | 23.2% | 44.2% |
| Range | 21.0% | 43.1% |
| Mean | 9.6% | 11.8% |
| Median | 8.9% | 9.7% |
| Interquartile 25% (IQ1) | 6.7% | 7.6% |
| Interquartile 75% (IQ3) | 12.1% | 14.2% |
| Interquartile Range (IQR) | 5.4% | 6.6% |
| Standard Deviation (Sample) | 5.0% | 8.2% |
| Standard Deviation (Population) | 5.0% | 8.1% |
Similar Demographics by Seniors Poverty Over the Age of 65
Demographics Similar to Mongolians by Seniors Poverty Over the Age of 65
In terms of seniors poverty over the age of 65, the demographic groups most similar to Mongolians are Sri Lankan (10.9%, a difference of 0.10%), Immigrants from Eastern Europe (10.9%, a difference of 0.20%), Alaska Native (10.8%, a difference of 0.22%), Nonimmigrants (10.9%, a difference of 0.26%), and Immigrants from Syria (10.9%, a difference of 0.30%).
| Demographics | Rating | Rank | Seniors Poverty Over the Age of 65 |
| Arabs | 65.2 /100 | #161 | Good 10.8% |
| Immigrants | Indonesia | 64.8 /100 | #162 | Good 10.8% |
| Tsimshian | 64.5 /100 | #163 | Good 10.8% |
| Potawatomi | 62.6 /100 | #164 | Good 10.8% |
| Immigrants | South Eastern Asia | 62.1 /100 | #165 | Good 10.8% |
| Malaysians | 62.0 /100 | #166 | Good 10.8% |
| Alaska Natives | 60.3 /100 | #167 | Good 10.8% |
| Mongolians | 58.0 /100 | #168 | Average 10.9% |
| Sri Lankans | 56.8 /100 | #169 | Average 10.9% |
| Immigrants | Eastern Europe | 55.8 /100 | #170 | Average 10.9% |
| Immigrants | Nonimmigrants | 55.1 /100 | #171 | Average 10.9% |
| Immigrants | Syria | 54.7 /100 | #172 | Average 10.9% |
| Spaniards | 50.7 /100 | #173 | Average 10.9% |
| Immigrants | Sudan | 50.0 /100 | #174 | Average 10.9% |
| Creek | 49.6 /100 | #175 | Average 10.9% |
Demographics Similar to Czechoslovakians by Seniors Poverty Over the Age of 65
In terms of seniors poverty over the age of 65, the demographic groups most similar to Czechoslovakians are Latvian (9.5%, a difference of 0.050%), British (9.4%, a difference of 0.43%), Scotch-Irish (9.5%, a difference of 0.50%), Belgian (9.5%, a difference of 0.52%), and Native Hawaiian (9.4%, a difference of 0.53%).
| Demographics | Rating | Rank | Seniors Poverty Over the Age of 65 |
| Bhutanese | 99.9 /100 | #29 | Exceptional 9.3% |
| Menominee | 99.8 /100 | #30 | Exceptional 9.4% |
| Finns | 99.8 /100 | #31 | Exceptional 9.4% |
| Northern Europeans | 99.8 /100 | #32 | Exceptional 9.4% |
| Native Hawaiians | 99.8 /100 | #33 | Exceptional 9.4% |
| British | 99.8 /100 | #34 | Exceptional 9.4% |
| Latvians | 99.8 /100 | #35 | Exceptional 9.5% |
| Czechoslovakians | 99.8 /100 | #36 | Exceptional 9.5% |
| Scotch-Irish | 99.7 /100 | #37 | Exceptional 9.5% |
| Belgians | 99.7 /100 | #38 | Exceptional 9.5% |
| Greeks | 99.6 /100 | #39 | Exceptional 9.6% |
| Assyrians/Chaldeans/Syriacs | 99.6 /100 | #40 | Exceptional 9.6% |
| Immigrants | North Macedonia | 99.6 /100 | #41 | Exceptional 9.6% |
| Zimbabweans | 99.6 /100 | #42 | Exceptional 9.6% |
| Eastern Europeans | 99.6 /100 | #43 | Exceptional 9.6% |