Mongolian vs Bangladeshi Seniors Poverty Over the Age of 65
COMPARE
Mongolian
Bangladeshi
Seniors Poverty Over the Age of 65
Seniors Poverty Over the Age of 65 Comparison
Mongolians
Bangladeshis
10.9%
SENIORS POVERTY OVER THE AGE OF 65
58.0/ 100
METRIC RATING
168th/ 347
METRIC RANK
11.2%
SENIORS POVERTY OVER THE AGE OF 65
25.2/ 100
METRIC RATING
196th/ 347
METRIC RANK
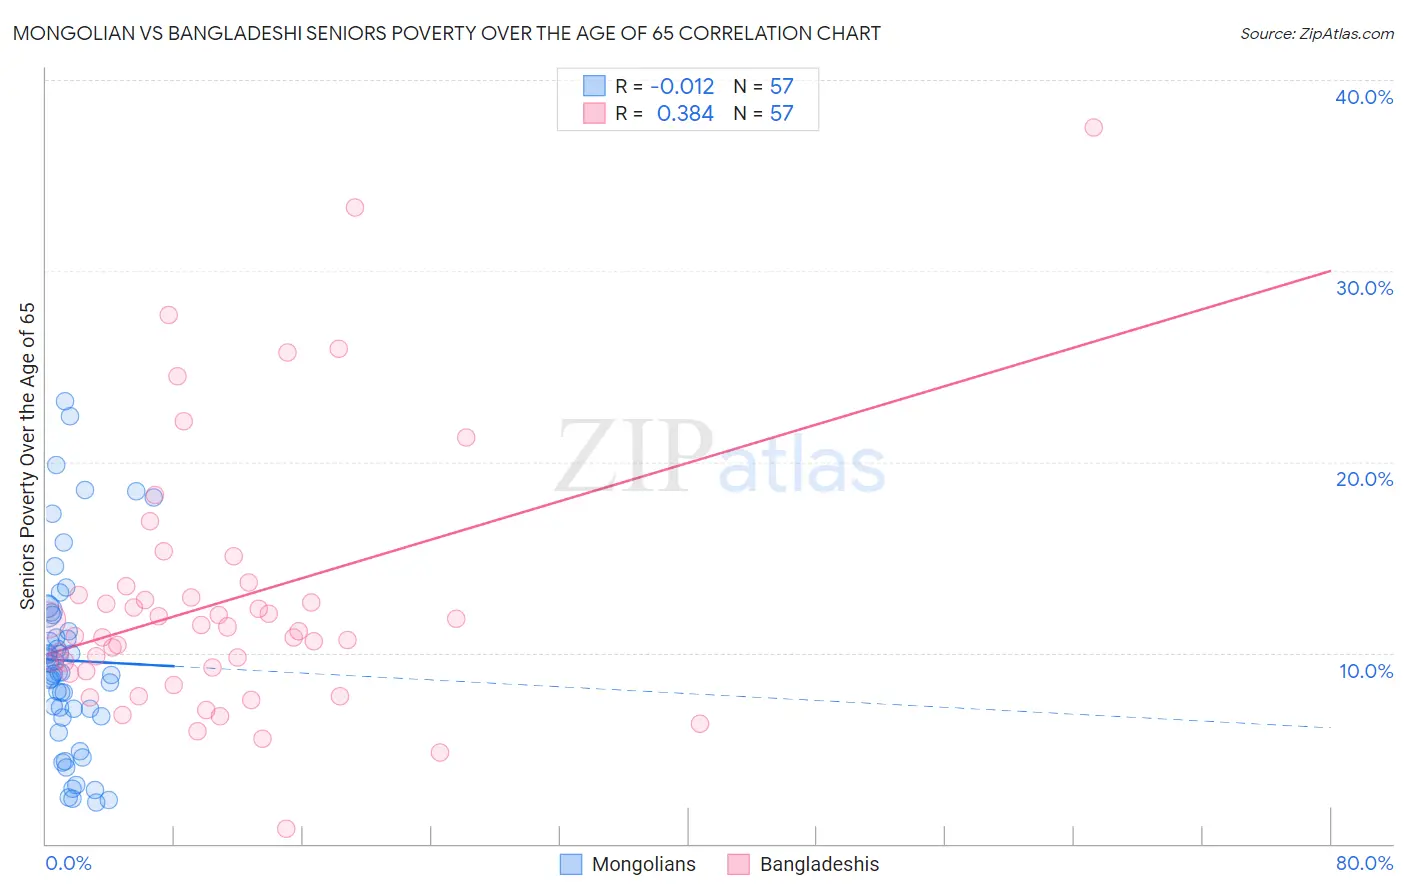
Mongolian vs Bangladeshi Seniors Poverty Over the Age of 65 Correlation Chart
The statistical analysis conducted on geographies consisting of 140,162,165 people shows no correlation between the proportion of Mongolians and poverty level among seniors over the age of 65 in the United States with a correlation coefficient (R) of -0.012 and weighted average of 10.9%. Similarly, the statistical analysis conducted on geographies consisting of 140,940,566 people shows a mild positive correlation between the proportion of Bangladeshis and poverty level among seniors over the age of 65 in the United States with a correlation coefficient (R) of 0.384 and weighted average of 11.2%, a difference of 3.2%.
Seniors Poverty Over the Age of 65 Correlation Summary
| Measurement | Mongolian | Bangladeshi |
| Minimum | 2.2% | 0.78% |
| Maximum | 23.2% | 37.5% |
| Range | 21.0% | 36.7% |
| Mean | 9.6% | 12.7% |
| Median | 8.9% | 11.1% |
| Interquartile 25% (IQ1) | 6.7% | 9.0% |
| Interquartile 75% (IQ3) | 12.1% | 13.3% |
| Interquartile Range (IQR) | 5.4% | 4.3% |
| Standard Deviation (Sample) | 5.0% | 6.9% |
| Standard Deviation (Population) | 5.0% | 6.8% |
Similar Demographics by Seniors Poverty Over the Age of 65
Demographics Similar to Mongolians by Seniors Poverty Over the Age of 65
In terms of seniors poverty over the age of 65, the demographic groups most similar to Mongolians are Sri Lankan (10.9%, a difference of 0.10%), Immigrants from Eastern Europe (10.9%, a difference of 0.20%), Alaska Native (10.8%, a difference of 0.22%), Nonimmigrants (10.9%, a difference of 0.26%), and Immigrants from Syria (10.9%, a difference of 0.30%).
| Demographics | Rating | Rank | Seniors Poverty Over the Age of 65 |
| Arabs | 65.2 /100 | #161 | Good 10.8% |
| Immigrants | Indonesia | 64.8 /100 | #162 | Good 10.8% |
| Tsimshian | 64.5 /100 | #163 | Good 10.8% |
| Potawatomi | 62.6 /100 | #164 | Good 10.8% |
| Immigrants | South Eastern Asia | 62.1 /100 | #165 | Good 10.8% |
| Malaysians | 62.0 /100 | #166 | Good 10.8% |
| Alaska Natives | 60.3 /100 | #167 | Good 10.8% |
| Mongolians | 58.0 /100 | #168 | Average 10.9% |
| Sri Lankans | 56.8 /100 | #169 | Average 10.9% |
| Immigrants | Eastern Europe | 55.8 /100 | #170 | Average 10.9% |
| Immigrants | Nonimmigrants | 55.1 /100 | #171 | Average 10.9% |
| Immigrants | Syria | 54.7 /100 | #172 | Average 10.9% |
| Spaniards | 50.7 /100 | #173 | Average 10.9% |
| Immigrants | Sudan | 50.0 /100 | #174 | Average 10.9% |
| Creek | 49.6 /100 | #175 | Average 10.9% |
Demographics Similar to Bangladeshis by Seniors Poverty Over the Age of 65
In terms of seniors poverty over the age of 65, the demographic groups most similar to Bangladeshis are Albanian (11.2%, a difference of 0.090%), Immigrants from Vietnam (11.2%, a difference of 0.16%), Chilean (11.2%, a difference of 0.30%), Taiwanese (11.2%, a difference of 0.45%), and Immigrants from Burma/Myanmar (11.3%, a difference of 0.47%).
| Demographics | Rating | Rank | Seniors Poverty Over the Age of 65 |
| Immigrants | Laos | 35.7 /100 | #189 | Fair 11.1% |
| Indians (Asian) | 34.2 /100 | #190 | Fair 11.1% |
| Immigrants | Uganda | 32.2 /100 | #191 | Fair 11.1% |
| Immigrants | Southern Europe | 30.1 /100 | #192 | Fair 11.1% |
| Taiwanese | 29.2 /100 | #193 | Fair 11.2% |
| Chileans | 27.8 /100 | #194 | Fair 11.2% |
| Immigrants | Vietnam | 26.6 /100 | #195 | Fair 11.2% |
| Bangladeshis | 25.2 /100 | #196 | Fair 11.2% |
| Albanians | 24.4 /100 | #197 | Fair 11.2% |
| Immigrants | Burma/Myanmar | 21.3 /100 | #198 | Fair 11.3% |
| Immigrants | Israel | 20.3 /100 | #199 | Fair 11.3% |
| Alsatians | 20.1 /100 | #200 | Fair 11.3% |
| Immigrants | Brazil | 17.8 /100 | #201 | Poor 11.3% |
| Costa Ricans | 17.0 /100 | #202 | Poor 11.3% |
| Immigrants | Zaire | 16.9 /100 | #203 | Poor 11.3% |