Mexican vs Immigrants from Morocco Single Male Poverty
COMPARE
Mexican
Immigrants from Morocco
Single Male Poverty
Single Male Poverty Comparison
Mexicans
Immigrants from Morocco
14.0%
SINGLE MALE POVERTY
0.1/ 100
METRIC RATING
272nd/ 347
METRIC RANK
12.3%
SINGLE MALE POVERTY
95.6/ 100
METRIC RATING
106th/ 347
METRIC RANK
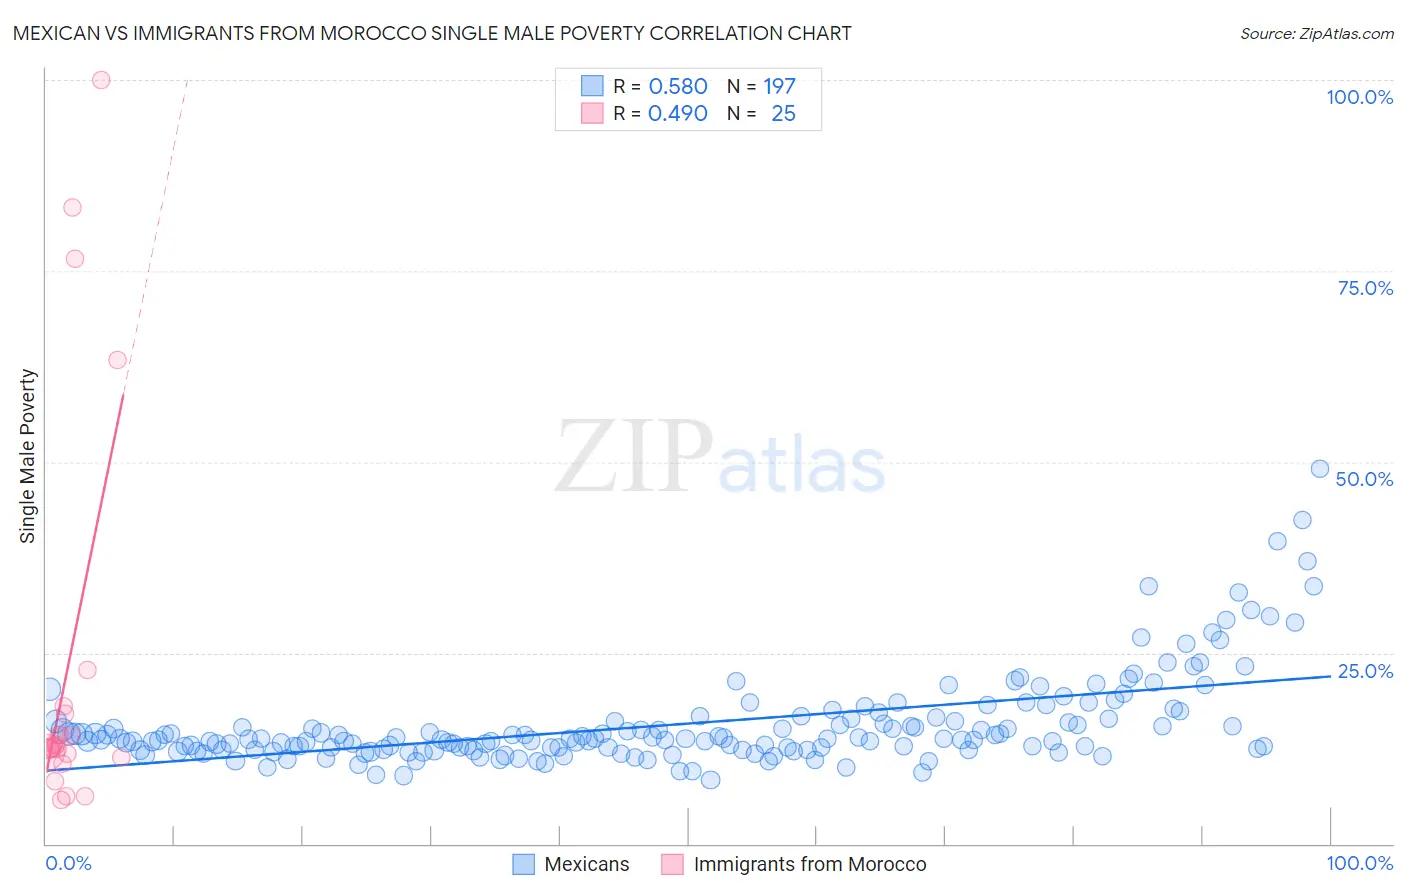
Mexican vs Immigrants from Morocco Single Male Poverty Correlation Chart
The statistical analysis conducted on geographies consisting of 471,672,286 people shows a substantial positive correlation between the proportion of Mexicans and poverty level among single males in the United States with a correlation coefficient (R) of 0.580 and weighted average of 14.0%. Similarly, the statistical analysis conducted on geographies consisting of 166,868,254 people shows a moderate positive correlation between the proportion of Immigrants from Morocco and poverty level among single males in the United States with a correlation coefficient (R) of 0.490 and weighted average of 12.3%, a difference of 13.9%.
Single Male Poverty Correlation Summary
| Measurement | Mexican | Immigrants from Morocco |
| Minimum | 8.4% | 5.8% |
| Maximum | 49.1% | 100.0% |
| Range | 40.7% | 94.2% |
| Mean | 15.6% | 23.3% |
| Median | 13.7% | 12.5% |
| Interquartile 25% (IQ1) | 12.3% | 11.5% |
| Interquartile 75% (IQ3) | 16.2% | 17.5% |
| Interquartile Range (IQR) | 3.9% | 5.9% |
| Standard Deviation (Sample) | 6.1% | 26.4% |
| Standard Deviation (Population) | 6.1% | 25.9% |
Similar Demographics by Single Male Poverty
Demographics Similar to Mexicans by Single Male Poverty
In terms of single male poverty, the demographic groups most similar to Mexicans are Irish (14.0%, a difference of 0.060%), Immigrants from Saudi Arabia (14.0%, a difference of 0.090%), Scottish (14.0%, a difference of 0.10%), Immigrants from Mexico (13.9%, a difference of 0.26%), and German (13.9%, a difference of 0.33%).
| Demographics | Rating | Rank | Single Male Poverty |
| Immigrants | Congo | 0.2 /100 | #265 | Tragic 13.9% |
| Immigrants | Cabo Verde | 0.1 /100 | #266 | Tragic 13.9% |
| Germans | 0.1 /100 | #267 | Tragic 13.9% |
| Immigrants | Mexico | 0.1 /100 | #268 | Tragic 13.9% |
| Scottish | 0.1 /100 | #269 | Tragic 14.0% |
| Immigrants | Saudi Arabia | 0.1 /100 | #270 | Tragic 14.0% |
| Irish | 0.1 /100 | #271 | Tragic 14.0% |
| Mexicans | 0.1 /100 | #272 | Tragic 14.0% |
| Welsh | 0.1 /100 | #273 | Tragic 14.0% |
| Hondurans | 0.1 /100 | #274 | Tragic 14.0% |
| English | 0.1 /100 | #275 | Tragic 14.1% |
| Dutch | 0.1 /100 | #276 | Tragic 14.1% |
| Immigrants | Honduras | 0.0 /100 | #277 | Tragic 14.1% |
| Slovaks | 0.0 /100 | #278 | Tragic 14.1% |
| Indonesians | 0.0 /100 | #279 | Tragic 14.1% |
Demographics Similar to Immigrants from Morocco by Single Male Poverty
In terms of single male poverty, the demographic groups most similar to Immigrants from Morocco are Jordanian (12.3%, a difference of 0.080%), Iraqi (12.3%, a difference of 0.18%), Immigrants from Eastern Africa (12.3%, a difference of 0.20%), Ugandan (12.3%, a difference of 0.33%), and Immigrants from Armenia (12.2%, a difference of 0.40%).
| Demographics | Rating | Rank | Single Male Poverty |
| Immigrants | Cuba | 97.3 /100 | #99 | Exceptional 12.2% |
| Immigrants | Australia | 97.1 /100 | #100 | Exceptional 12.2% |
| Immigrants | Latvia | 97.0 /100 | #101 | Exceptional 12.2% |
| Immigrants | Europe | 97.0 /100 | #102 | Exceptional 12.2% |
| Immigrants | Armenia | 96.7 /100 | #103 | Exceptional 12.2% |
| Immigrants | Kazakhstan | 96.7 /100 | #104 | Exceptional 12.2% |
| Jordanians | 95.9 /100 | #105 | Exceptional 12.3% |
| Immigrants | Morocco | 95.6 /100 | #106 | Exceptional 12.3% |
| Iraqis | 95.1 /100 | #107 | Exceptional 12.3% |
| Immigrants | Eastern Africa | 95.0 /100 | #108 | Exceptional 12.3% |
| Ugandans | 94.5 /100 | #109 | Exceptional 12.3% |
| Immigrants | Portugal | 93.6 /100 | #110 | Exceptional 12.3% |
| Immigrants | North Macedonia | 93.6 /100 | #111 | Exceptional 12.3% |
| Kenyans | 93.3 /100 | #112 | Exceptional 12.4% |
| Pakistanis | 92.4 /100 | #113 | Exceptional 12.4% |