Houma vs Immigrants from Morocco Single Male Poverty
COMPARE
Houma
Immigrants from Morocco
Single Male Poverty
Single Male Poverty Comparison
Houma
Immigrants from Morocco
23.5%
SINGLE MALE POVERTY
0.0/ 100
METRIC RATING
342nd/ 347
METRIC RANK
12.3%
SINGLE MALE POVERTY
95.6/ 100
METRIC RATING
106th/ 347
METRIC RANK
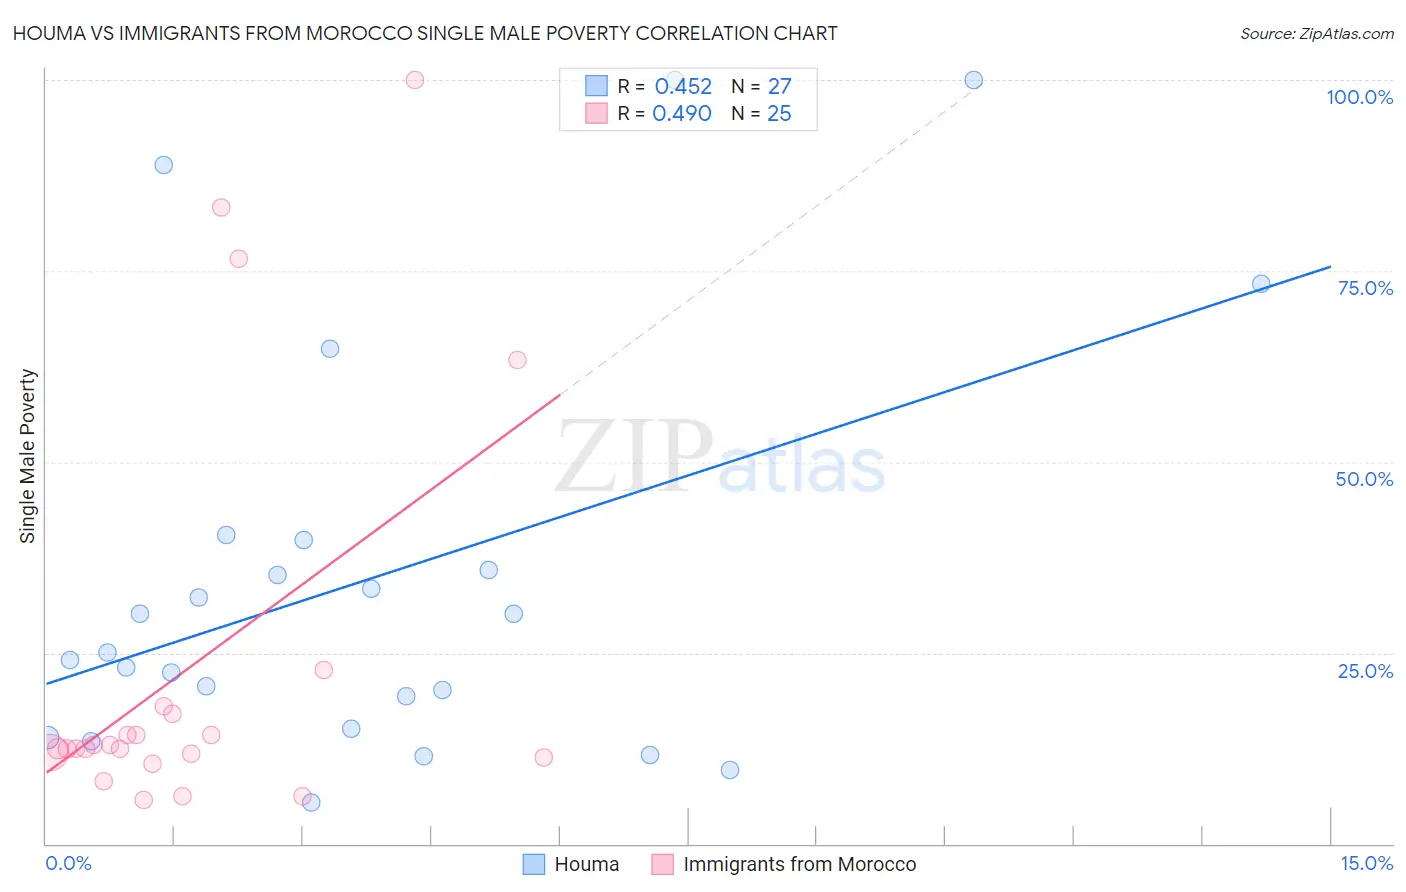
Houma vs Immigrants from Morocco Single Male Poverty Correlation Chart
The statistical analysis conducted on geographies consisting of 35,894,228 people shows a moderate positive correlation between the proportion of Houma and poverty level among single males in the United States with a correlation coefficient (R) of 0.452 and weighted average of 23.5%. Similarly, the statistical analysis conducted on geographies consisting of 166,868,254 people shows a moderate positive correlation between the proportion of Immigrants from Morocco and poverty level among single males in the United States with a correlation coefficient (R) of 0.490 and weighted average of 12.3%, a difference of 91.0%.
Single Male Poverty Correlation Summary
| Measurement | Houma | Immigrants from Morocco |
| Minimum | 5.4% | 5.8% |
| Maximum | 100.0% | 100.0% |
| Range | 94.6% | 94.2% |
| Mean | 34.8% | 23.3% |
| Median | 25.0% | 12.5% |
| Interquartile 25% (IQ1) | 15.1% | 11.5% |
| Interquartile 75% (IQ3) | 39.7% | 17.5% |
| Interquartile Range (IQR) | 24.7% | 5.9% |
| Standard Deviation (Sample) | 27.0% | 26.4% |
| Standard Deviation (Population) | 26.5% | 25.9% |
Similar Demographics by Single Male Poverty
Demographics Similar to Houma by Single Male Poverty
In terms of single male poverty, the demographic groups most similar to Houma are Crow (23.3%, a difference of 0.82%), Sioux (22.2%, a difference of 5.6%), Arapaho (21.9%, a difference of 6.9%), Puerto Rican (25.1%, a difference of 6.9%), and Lumbee (25.2%, a difference of 7.3%).
| Demographics | Rating | Rank | Single Male Poverty |
| Inupiat | 0.0 /100 | #333 | Tragic 20.0% |
| Pima | 0.0 /100 | #334 | Tragic 20.2% |
| Yuman | 0.0 /100 | #335 | Tragic 21.3% |
| Tohono O'odham | 0.0 /100 | #336 | Tragic 21.6% |
| Apache | 0.0 /100 | #337 | Tragic 21.6% |
| Pueblo | 0.0 /100 | #338 | Tragic 21.6% |
| Arapaho | 0.0 /100 | #339 | Tragic 21.9% |
| Sioux | 0.0 /100 | #340 | Tragic 22.2% |
| Crow | 0.0 /100 | #341 | Tragic 23.3% |
| Houma | 0.0 /100 | #342 | Tragic 23.5% |
| Puerto Ricans | 0.0 /100 | #343 | Tragic 25.1% |
| Lumbee | 0.0 /100 | #344 | Tragic 25.2% |
| Navajo | 0.0 /100 | #345 | Tragic 25.3% |
| Hopi | 0.0 /100 | #346 | Tragic 27.5% |
| Yup'ik | 0.0 /100 | #347 | Tragic 31.6% |
Demographics Similar to Immigrants from Morocco by Single Male Poverty
In terms of single male poverty, the demographic groups most similar to Immigrants from Morocco are Jordanian (12.3%, a difference of 0.080%), Iraqi (12.3%, a difference of 0.18%), Immigrants from Eastern Africa (12.3%, a difference of 0.20%), Ugandan (12.3%, a difference of 0.33%), and Immigrants from Armenia (12.2%, a difference of 0.40%).
| Demographics | Rating | Rank | Single Male Poverty |
| Immigrants | Cuba | 97.3 /100 | #99 | Exceptional 12.2% |
| Immigrants | Australia | 97.1 /100 | #100 | Exceptional 12.2% |
| Immigrants | Latvia | 97.0 /100 | #101 | Exceptional 12.2% |
| Immigrants | Europe | 97.0 /100 | #102 | Exceptional 12.2% |
| Immigrants | Armenia | 96.7 /100 | #103 | Exceptional 12.2% |
| Immigrants | Kazakhstan | 96.7 /100 | #104 | Exceptional 12.2% |
| Jordanians | 95.9 /100 | #105 | Exceptional 12.3% |
| Immigrants | Morocco | 95.6 /100 | #106 | Exceptional 12.3% |
| Iraqis | 95.1 /100 | #107 | Exceptional 12.3% |
| Immigrants | Eastern Africa | 95.0 /100 | #108 | Exceptional 12.3% |
| Ugandans | 94.5 /100 | #109 | Exceptional 12.3% |
| Immigrants | Portugal | 93.6 /100 | #110 | Exceptional 12.3% |
| Immigrants | North Macedonia | 93.6 /100 | #111 | Exceptional 12.3% |
| Kenyans | 93.3 /100 | #112 | Exceptional 12.4% |
| Pakistanis | 92.4 /100 | #113 | Exceptional 12.4% |