Mexican vs Czechoslovakian Single Male Poverty
COMPARE
Mexican
Czechoslovakian
Single Male Poverty
Single Male Poverty Comparison
Mexicans
Czechoslovakians
14.0%
SINGLE MALE POVERTY
0.1/ 100
METRIC RATING
272nd/ 347
METRIC RANK
13.4%
SINGLE MALE POVERTY
3.0/ 100
METRIC RATING
239th/ 347
METRIC RANK
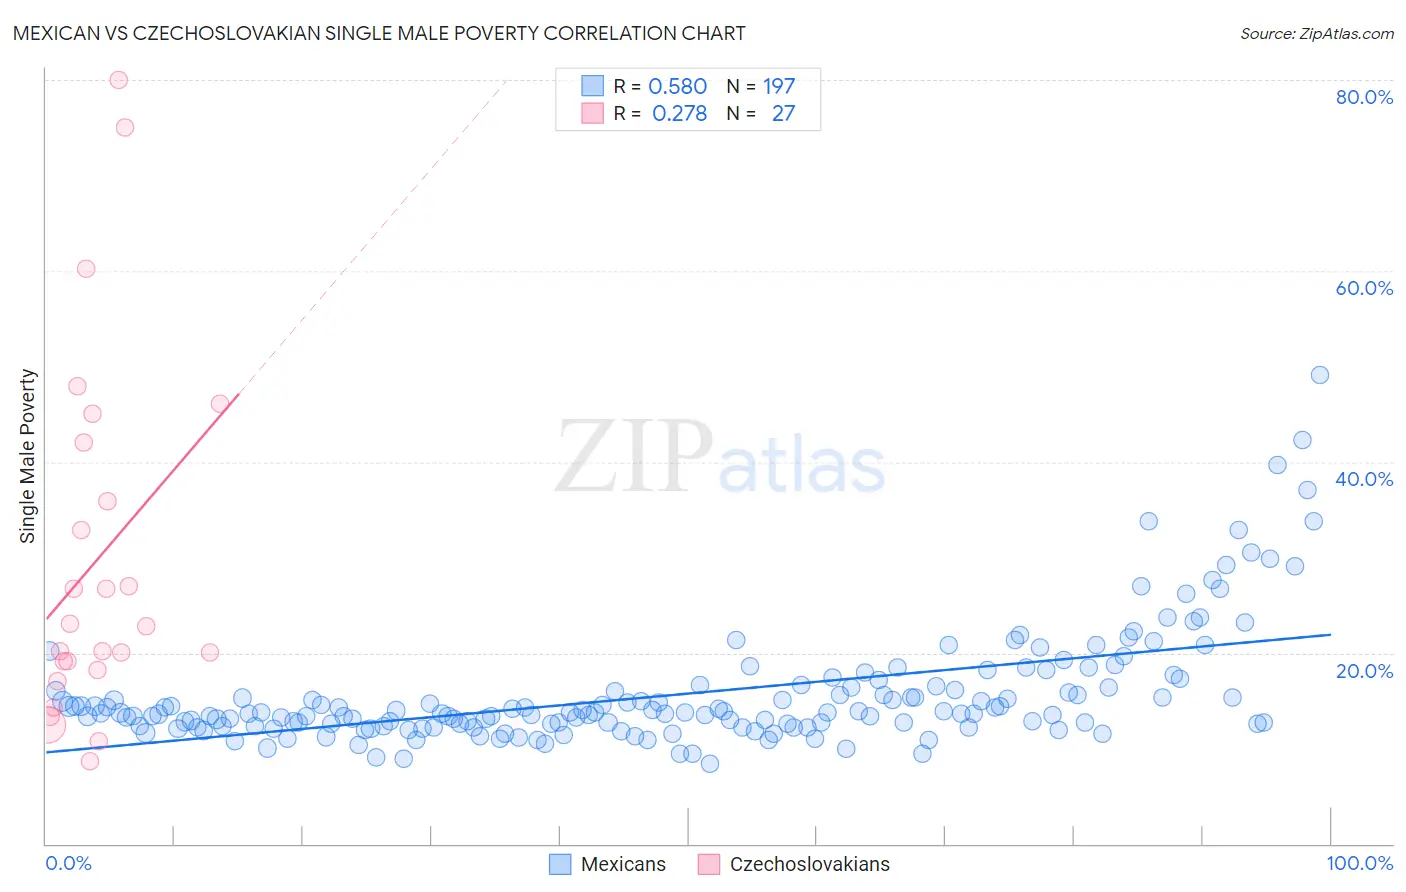
Mexican vs Czechoslovakian Single Male Poverty Correlation Chart
The statistical analysis conducted on geographies consisting of 471,672,286 people shows a substantial positive correlation between the proportion of Mexicans and poverty level among single males in the United States with a correlation coefficient (R) of 0.580 and weighted average of 14.0%. Similarly, the statistical analysis conducted on geographies consisting of 321,828,483 people shows a weak positive correlation between the proportion of Czechoslovakians and poverty level among single males in the United States with a correlation coefficient (R) of 0.278 and weighted average of 13.4%, a difference of 4.5%.
Single Male Poverty Correlation Summary
| Measurement | Mexican | Czechoslovakian |
| Minimum | 8.4% | 8.6% |
| Maximum | 49.1% | 80.0% |
| Range | 40.7% | 71.4% |
| Mean | 15.6% | 29.8% |
| Median | 13.7% | 22.7% |
| Interquartile 25% (IQ1) | 12.3% | 18.2% |
| Interquartile 75% (IQ3) | 16.2% | 42.1% |
| Interquartile Range (IQR) | 3.9% | 23.9% |
| Standard Deviation (Sample) | 6.1% | 18.8% |
| Standard Deviation (Population) | 6.1% | 18.4% |
Similar Demographics by Single Male Poverty
Demographics Similar to Mexicans by Single Male Poverty
In terms of single male poverty, the demographic groups most similar to Mexicans are Irish (14.0%, a difference of 0.060%), Immigrants from Saudi Arabia (14.0%, a difference of 0.090%), Scottish (14.0%, a difference of 0.10%), Immigrants from Mexico (13.9%, a difference of 0.26%), and German (13.9%, a difference of 0.33%).
| Demographics | Rating | Rank | Single Male Poverty |
| Immigrants | Congo | 0.2 /100 | #265 | Tragic 13.9% |
| Immigrants | Cabo Verde | 0.1 /100 | #266 | Tragic 13.9% |
| Germans | 0.1 /100 | #267 | Tragic 13.9% |
| Immigrants | Mexico | 0.1 /100 | #268 | Tragic 13.9% |
| Scottish | 0.1 /100 | #269 | Tragic 14.0% |
| Immigrants | Saudi Arabia | 0.1 /100 | #270 | Tragic 14.0% |
| Irish | 0.1 /100 | #271 | Tragic 14.0% |
| Mexicans | 0.1 /100 | #272 | Tragic 14.0% |
| Welsh | 0.1 /100 | #273 | Tragic 14.0% |
| Hondurans | 0.1 /100 | #274 | Tragic 14.0% |
| English | 0.1 /100 | #275 | Tragic 14.1% |
| Dutch | 0.1 /100 | #276 | Tragic 14.1% |
| Immigrants | Honduras | 0.0 /100 | #277 | Tragic 14.1% |
| Slovaks | 0.0 /100 | #278 | Tragic 14.1% |
| Indonesians | 0.0 /100 | #279 | Tragic 14.1% |
Demographics Similar to Czechoslovakians by Single Male Poverty
In terms of single male poverty, the demographic groups most similar to Czechoslovakians are Immigrants from Ghana (13.4%, a difference of 0.080%), British West Indian (13.4%, a difference of 0.18%), Luxembourger (13.4%, a difference of 0.24%), Bangladeshi (13.3%, a difference of 0.29%), and Belizean (13.4%, a difference of 0.30%).
| Demographics | Rating | Rank | Single Male Poverty |
| Immigrants | Caribbean | 5.0 /100 | #232 | Tragic 13.3% |
| British | 4.0 /100 | #233 | Tragic 13.3% |
| Canadians | 4.0 /100 | #234 | Tragic 13.3% |
| Bangladeshis | 3.7 /100 | #235 | Tragic 13.3% |
| Luxembourgers | 3.6 /100 | #236 | Tragic 13.4% |
| British West Indians | 3.4 /100 | #237 | Tragic 13.4% |
| Immigrants | Ghana | 3.2 /100 | #238 | Tragic 13.4% |
| Czechoslovakians | 3.0 /100 | #239 | Tragic 13.4% |
| Belizeans | 2.3 /100 | #240 | Tragic 13.4% |
| Immigrants | Germany | 2.1 /100 | #241 | Tragic 13.4% |
| Carpatho Rusyns | 2.1 /100 | #242 | Tragic 13.4% |
| Barbadians | 2.1 /100 | #243 | Tragic 13.4% |
| Immigrants | Senegal | 1.7 /100 | #244 | Tragic 13.5% |
| Immigrants | Latin America | 1.3 /100 | #245 | Tragic 13.5% |
| Immigrants | Micronesia | 1.2 /100 | #246 | Tragic 13.5% |