Menominee vs Immigrants from Laos Single Female Poverty
COMPARE
Menominee
Immigrants from Laos
Single Female Poverty
Single Female Poverty Comparison
Menominee
Immigrants from Laos
27.8%
SINGLE FEMALE POVERTY
0.0/ 100
METRIC RATING
329th/ 347
METRIC RANK
22.9%
SINGLE FEMALE POVERTY
0.3/ 100
METRIC RATING
264th/ 347
METRIC RANK
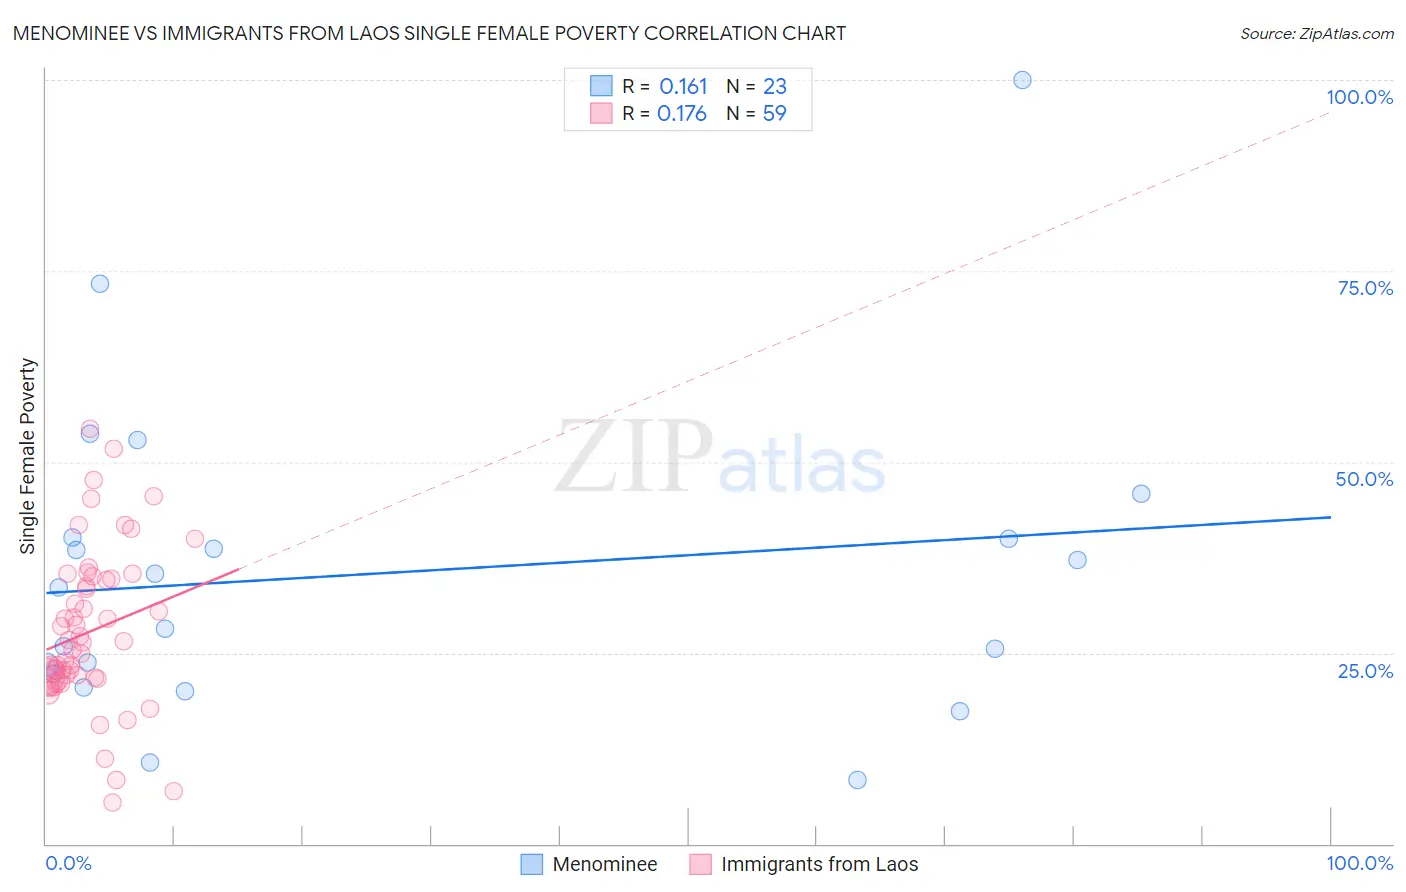
Menominee vs Immigrants from Laos Single Female Poverty Correlation Chart
The statistical analysis conducted on geographies consisting of 45,620,212 people shows a poor positive correlation between the proportion of Menominee and poverty level among single females in the United States with a correlation coefficient (R) of 0.161 and weighted average of 27.8%. Similarly, the statistical analysis conducted on geographies consisting of 200,096,236 people shows a poor positive correlation between the proportion of Immigrants from Laos and poverty level among single females in the United States with a correlation coefficient (R) of 0.176 and weighted average of 22.9%, a difference of 21.3%.
Single Female Poverty Correlation Summary
| Measurement | Menominee | Immigrants from Laos |
| Minimum | 8.3% | 5.4% |
| Maximum | 100.0% | 54.3% |
| Range | 91.7% | 48.9% |
| Mean | 35.4% | 27.8% |
| Median | 33.5% | 26.4% |
| Interquartile 25% (IQ1) | 22.3% | 21.6% |
| Interquartile 75% (IQ3) | 40.1% | 34.7% |
| Interquartile Range (IQR) | 17.8% | 13.1% |
| Standard Deviation (Sample) | 20.5% | 10.3% |
| Standard Deviation (Population) | 20.1% | 10.2% |
Similar Demographics by Single Female Poverty
Demographics Similar to Menominee by Single Female Poverty
In terms of single female poverty, the demographic groups most similar to Menominee are Apache (27.7%, a difference of 0.46%), Hopi (28.0%, a difference of 0.71%), Native/Alaskan (28.2%, a difference of 1.3%), Dutch West Indian (27.5%, a difference of 1.4%), and Creek (27.4%, a difference of 1.5%).
| Demographics | Rating | Rank | Single Female Poverty |
| Seminole | 0.0 /100 | #322 | Tragic 26.8% |
| Chippewa | 0.0 /100 | #323 | Tragic 26.8% |
| Kiowa | 0.0 /100 | #324 | Tragic 26.9% |
| Choctaw | 0.0 /100 | #325 | Tragic 27.2% |
| Creek | 0.0 /100 | #326 | Tragic 27.4% |
| Dutch West Indians | 0.0 /100 | #327 | Tragic 27.5% |
| Apache | 0.0 /100 | #328 | Tragic 27.7% |
| Menominee | 0.0 /100 | #329 | Tragic 27.8% |
| Hopi | 0.0 /100 | #330 | Tragic 28.0% |
| Natives/Alaskans | 0.0 /100 | #331 | Tragic 28.2% |
| Yakama | 0.0 /100 | #332 | Tragic 28.3% |
| Ute | 0.0 /100 | #333 | Tragic 28.4% |
| Pueblo | 0.0 /100 | #334 | Tragic 28.6% |
| Immigrants | Yemen | 0.0 /100 | #335 | Tragic 28.9% |
| Colville | 0.0 /100 | #336 | Tragic 29.1% |
Demographics Similar to Immigrants from Laos by Single Female Poverty
In terms of single female poverty, the demographic groups most similar to Immigrants from Laos are Scotch-Irish (22.9%, a difference of 0.070%), Central American (23.0%, a difference of 0.17%), Immigrants from Micronesia (23.0%, a difference of 0.38%), Senegalese (23.0%, a difference of 0.44%), and British West Indian (22.8%, a difference of 0.48%).
| Demographics | Rating | Rank | Single Female Poverty |
| Sudanese | 0.7 /100 | #257 | Tragic 22.6% |
| Bahamians | 0.6 /100 | #258 | Tragic 22.7% |
| Whites/Caucasians | 0.6 /100 | #259 | Tragic 22.7% |
| Celtics | 0.5 /100 | #260 | Tragic 22.7% |
| Immigrants | Cabo Verde | 0.4 /100 | #261 | Tragic 22.8% |
| British West Indians | 0.4 /100 | #262 | Tragic 22.8% |
| Scotch-Irish | 0.3 /100 | #263 | Tragic 22.9% |
| Immigrants | Laos | 0.3 /100 | #264 | Tragic 22.9% |
| Central Americans | 0.2 /100 | #265 | Tragic 23.0% |
| Immigrants | Micronesia | 0.2 /100 | #266 | Tragic 23.0% |
| Senegalese | 0.2 /100 | #267 | Tragic 23.0% |
| Fijians | 0.2 /100 | #268 | Tragic 23.1% |
| Hmong | 0.2 /100 | #269 | Tragic 23.1% |
| Inupiat | 0.2 /100 | #270 | Tragic 23.1% |
| Sub-Saharan Africans | 0.1 /100 | #271 | Tragic 23.2% |