Menominee vs Immigrants from Kenya Single Female Poverty
COMPARE
Menominee
Immigrants from Kenya
Single Female Poverty
Single Female Poverty Comparison
Menominee
Immigrants from Kenya
27.8%
SINGLE FEMALE POVERTY
0.0/ 100
METRIC RATING
329th/ 347
METRIC RANK
21.4%
SINGLE FEMALE POVERTY
20.7/ 100
METRIC RATING
202nd/ 347
METRIC RANK
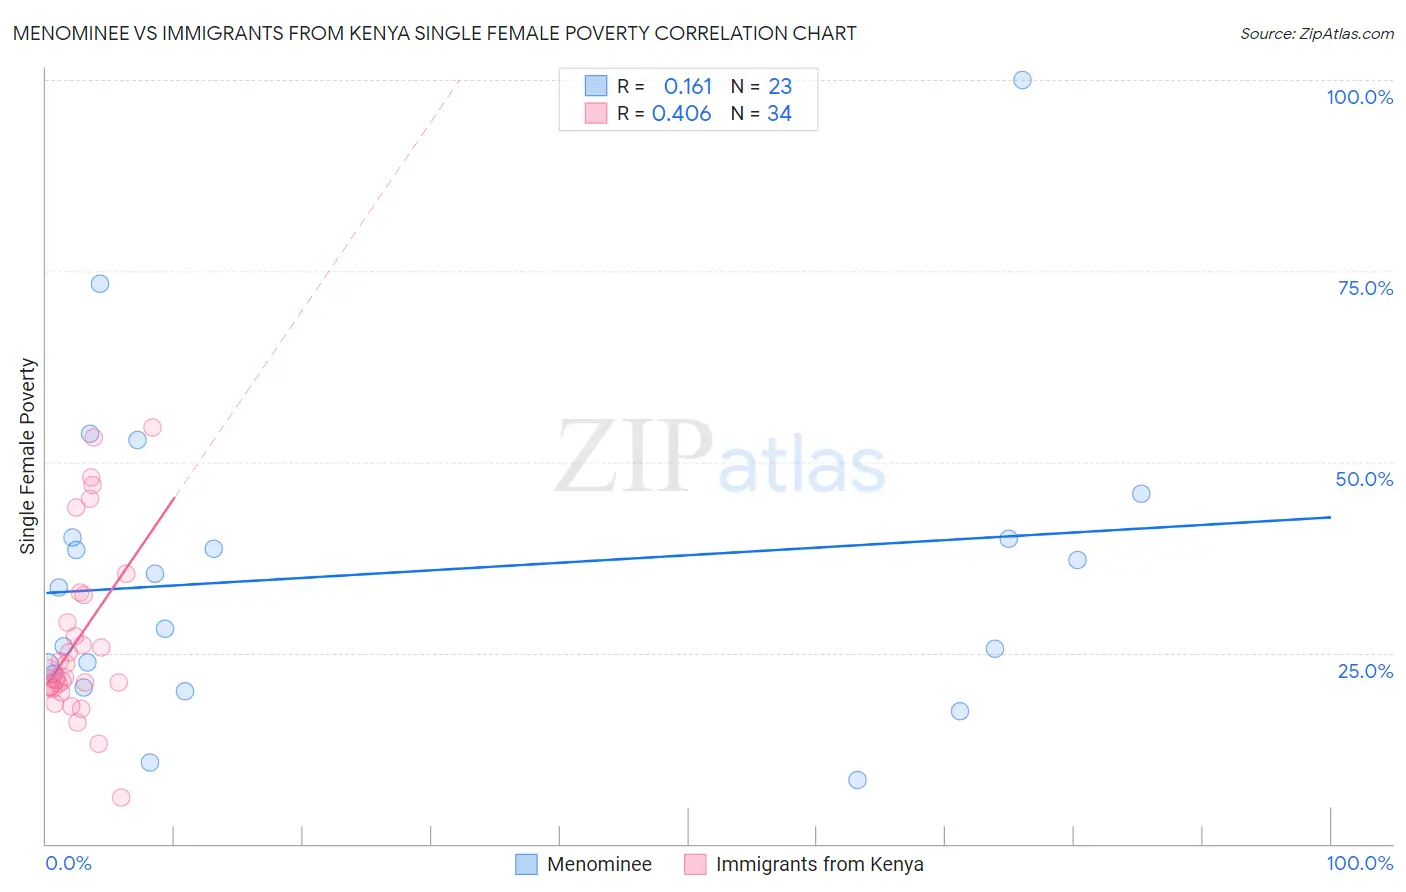
Menominee vs Immigrants from Kenya Single Female Poverty Correlation Chart
The statistical analysis conducted on geographies consisting of 45,620,212 people shows a poor positive correlation between the proportion of Menominee and poverty level among single females in the United States with a correlation coefficient (R) of 0.161 and weighted average of 27.8%. Similarly, the statistical analysis conducted on geographies consisting of 216,607,020 people shows a moderate positive correlation between the proportion of Immigrants from Kenya and poverty level among single females in the United States with a correlation coefficient (R) of 0.406 and weighted average of 21.4%, a difference of 29.8%.
Single Female Poverty Correlation Summary
| Measurement | Menominee | Immigrants from Kenya |
| Minimum | 8.3% | 6.1% |
| Maximum | 100.0% | 54.5% |
| Range | 91.7% | 48.4% |
| Mean | 35.4% | 26.9% |
| Median | 33.5% | 21.8% |
| Interquartile 25% (IQ1) | 22.3% | 20.5% |
| Interquartile 75% (IQ3) | 40.1% | 32.6% |
| Interquartile Range (IQR) | 17.8% | 12.0% |
| Standard Deviation (Sample) | 20.5% | 11.7% |
| Standard Deviation (Population) | 20.1% | 11.5% |
Similar Demographics by Single Female Poverty
Demographics Similar to Menominee by Single Female Poverty
In terms of single female poverty, the demographic groups most similar to Menominee are Apache (27.7%, a difference of 0.46%), Hopi (28.0%, a difference of 0.71%), Native/Alaskan (28.2%, a difference of 1.3%), Dutch West Indian (27.5%, a difference of 1.4%), and Creek (27.4%, a difference of 1.5%).
| Demographics | Rating | Rank | Single Female Poverty |
| Seminole | 0.0 /100 | #322 | Tragic 26.8% |
| Chippewa | 0.0 /100 | #323 | Tragic 26.8% |
| Kiowa | 0.0 /100 | #324 | Tragic 26.9% |
| Choctaw | 0.0 /100 | #325 | Tragic 27.2% |
| Creek | 0.0 /100 | #326 | Tragic 27.4% |
| Dutch West Indians | 0.0 /100 | #327 | Tragic 27.5% |
| Apache | 0.0 /100 | #328 | Tragic 27.7% |
| Menominee | 0.0 /100 | #329 | Tragic 27.8% |
| Hopi | 0.0 /100 | #330 | Tragic 28.0% |
| Natives/Alaskans | 0.0 /100 | #331 | Tragic 28.2% |
| Yakama | 0.0 /100 | #332 | Tragic 28.3% |
| Ute | 0.0 /100 | #333 | Tragic 28.4% |
| Pueblo | 0.0 /100 | #334 | Tragic 28.6% |
| Immigrants | Yemen | 0.0 /100 | #335 | Tragic 28.9% |
| Colville | 0.0 /100 | #336 | Tragic 29.1% |
Demographics Similar to Immigrants from Kenya by Single Female Poverty
In terms of single female poverty, the demographic groups most similar to Immigrants from Kenya are Nigerian (21.4%, a difference of 0.020%), Irish (21.4%, a difference of 0.070%), Immigrants (21.4%, a difference of 0.12%), Immigrants from Haiti (21.5%, a difference of 0.18%), and Swiss (21.4%, a difference of 0.31%).
| Demographics | Rating | Rank | Single Female Poverty |
| Nicaraguans | 27.6 /100 | #195 | Fair 21.3% |
| Immigrants | Saudi Arabia | 27.1 /100 | #196 | Fair 21.3% |
| Japanese | 26.4 /100 | #197 | Fair 21.3% |
| Swiss | 24.2 /100 | #198 | Fair 21.4% |
| Immigrants | Immigrants | 22.0 /100 | #199 | Fair 21.4% |
| Irish | 21.4 /100 | #200 | Fair 21.4% |
| Nigerians | 20.9 /100 | #201 | Fair 21.4% |
| Immigrants | Kenya | 20.7 /100 | #202 | Fair 21.4% |
| Immigrants | Haiti | 18.8 /100 | #203 | Poor 21.5% |
| Immigrants | Africa | 16.7 /100 | #204 | Poor 21.5% |
| Finns | 16.2 /100 | #205 | Poor 21.5% |
| Belgians | 16.1 /100 | #206 | Poor 21.5% |
| Ghanaians | 15.7 /100 | #207 | Poor 21.6% |
| Haitians | 15.4 /100 | #208 | Poor 21.6% |
| Immigrants | Eastern Africa | 15.1 /100 | #209 | Poor 21.6% |