Menominee vs French Single Female Poverty
COMPARE
Menominee
French
Single Female Poverty
Single Female Poverty Comparison
Menominee
French
27.8%
SINGLE FEMALE POVERTY
0.0/ 100
METRIC RATING
329th/ 347
METRIC RANK
22.2%
SINGLE FEMALE POVERTY
2.3/ 100
METRIC RATING
240th/ 347
METRIC RANK
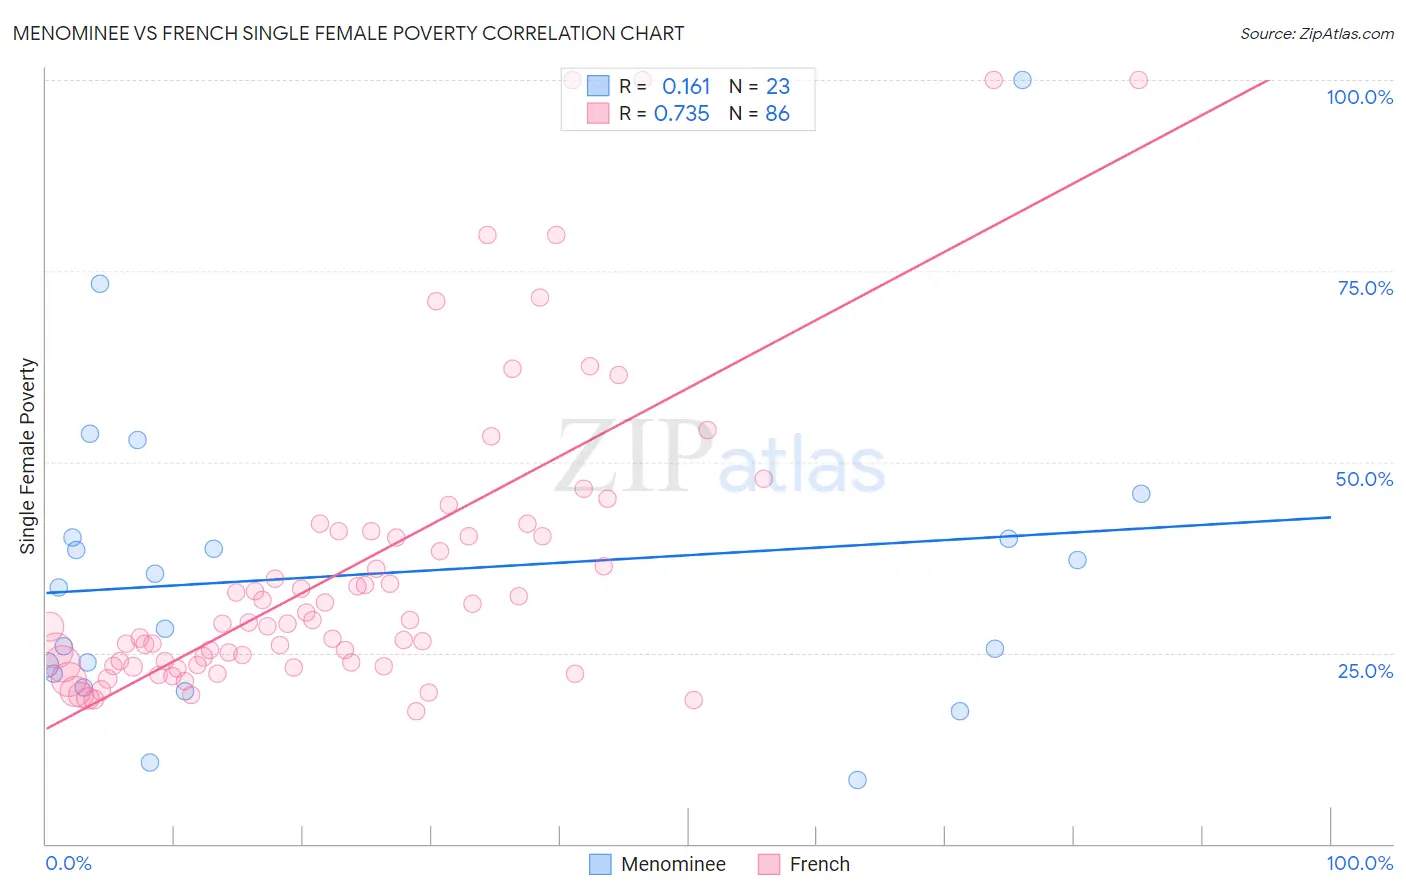
Menominee vs French Single Female Poverty Correlation Chart
The statistical analysis conducted on geographies consisting of 45,620,212 people shows a poor positive correlation between the proportion of Menominee and poverty level among single females in the United States with a correlation coefficient (R) of 0.161 and weighted average of 27.8%. Similarly, the statistical analysis conducted on geographies consisting of 551,878,026 people shows a strong positive correlation between the proportion of French and poverty level among single females in the United States with a correlation coefficient (R) of 0.735 and weighted average of 22.2%, a difference of 25.2%.
Single Female Poverty Correlation Summary
| Measurement | Menominee | French |
| Minimum | 8.3% | 17.3% |
| Maximum | 100.0% | 100.0% |
| Range | 91.7% | 82.7% |
| Mean | 35.4% | 36.0% |
| Median | 33.5% | 28.8% |
| Interquartile 25% (IQ1) | 22.3% | 23.4% |
| Interquartile 75% (IQ3) | 40.1% | 40.3% |
| Interquartile Range (IQR) | 17.8% | 17.0% |
| Standard Deviation (Sample) | 20.5% | 19.8% |
| Standard Deviation (Population) | 20.1% | 19.7% |
Similar Demographics by Single Female Poverty
Demographics Similar to Menominee by Single Female Poverty
In terms of single female poverty, the demographic groups most similar to Menominee are Apache (27.7%, a difference of 0.46%), Hopi (28.0%, a difference of 0.71%), Native/Alaskan (28.2%, a difference of 1.3%), Dutch West Indian (27.5%, a difference of 1.4%), and Creek (27.4%, a difference of 1.5%).
| Demographics | Rating | Rank | Single Female Poverty |
| Seminole | 0.0 /100 | #322 | Tragic 26.8% |
| Chippewa | 0.0 /100 | #323 | Tragic 26.8% |
| Kiowa | 0.0 /100 | #324 | Tragic 26.9% |
| Choctaw | 0.0 /100 | #325 | Tragic 27.2% |
| Creek | 0.0 /100 | #326 | Tragic 27.4% |
| Dutch West Indians | 0.0 /100 | #327 | Tragic 27.5% |
| Apache | 0.0 /100 | #328 | Tragic 27.7% |
| Menominee | 0.0 /100 | #329 | Tragic 27.8% |
| Hopi | 0.0 /100 | #330 | Tragic 28.0% |
| Natives/Alaskans | 0.0 /100 | #331 | Tragic 28.2% |
| Yakama | 0.0 /100 | #332 | Tragic 28.3% |
| Ute | 0.0 /100 | #333 | Tragic 28.4% |
| Pueblo | 0.0 /100 | #334 | Tragic 28.6% |
| Immigrants | Yemen | 0.0 /100 | #335 | Tragic 28.9% |
| Colville | 0.0 /100 | #336 | Tragic 29.1% |
Demographics Similar to French by Single Female Poverty
In terms of single female poverty, the demographic groups most similar to French are Cape Verdean (22.3%, a difference of 0.14%), Bermudan (22.3%, a difference of 0.21%), Malaysian (22.2%, a difference of 0.26%), French Canadian (22.2%, a difference of 0.27%), and West Indian (22.3%, a difference of 0.30%).
| Demographics | Rating | Rank | Single Female Poverty |
| Spaniards | 4.7 /100 | #233 | Tragic 22.0% |
| Spanish | 4.7 /100 | #234 | Tragic 22.0% |
| Dutch | 4.6 /100 | #235 | Tragic 22.0% |
| Immigrants | Ecuador | 4.2 /100 | #236 | Tragic 22.0% |
| Vietnamese | 4.0 /100 | #237 | Tragic 22.0% |
| French Canadians | 2.8 /100 | #238 | Tragic 22.2% |
| Malaysians | 2.8 /100 | #239 | Tragic 22.2% |
| French | 2.3 /100 | #240 | Tragic 22.2% |
| Cape Verdeans | 2.1 /100 | #241 | Tragic 22.3% |
| Bermudans | 2.0 /100 | #242 | Tragic 22.3% |
| West Indians | 1.9 /100 | #243 | Tragic 22.3% |
| Immigrants | Middle Africa | 1.9 /100 | #244 | Tragic 22.3% |
| Immigrants | Bangladesh | 1.8 /100 | #245 | Tragic 22.3% |
| Liberians | 1.4 /100 | #246 | Tragic 22.4% |
| Immigrants | El Salvador | 1.4 /100 | #247 | Tragic 22.4% |