Maltese vs Yugoslavian Male Poverty
COMPARE
Maltese
Yugoslavian
Male Poverty
Male Poverty Comparison
Maltese
Yugoslavians
9.1%
MALE POVERTY
100.0/ 100
METRIC RATING
5th/ 347
METRIC RANK
10.8%
MALE POVERTY
78.2/ 100
METRIC RATING
138th/ 347
METRIC RANK
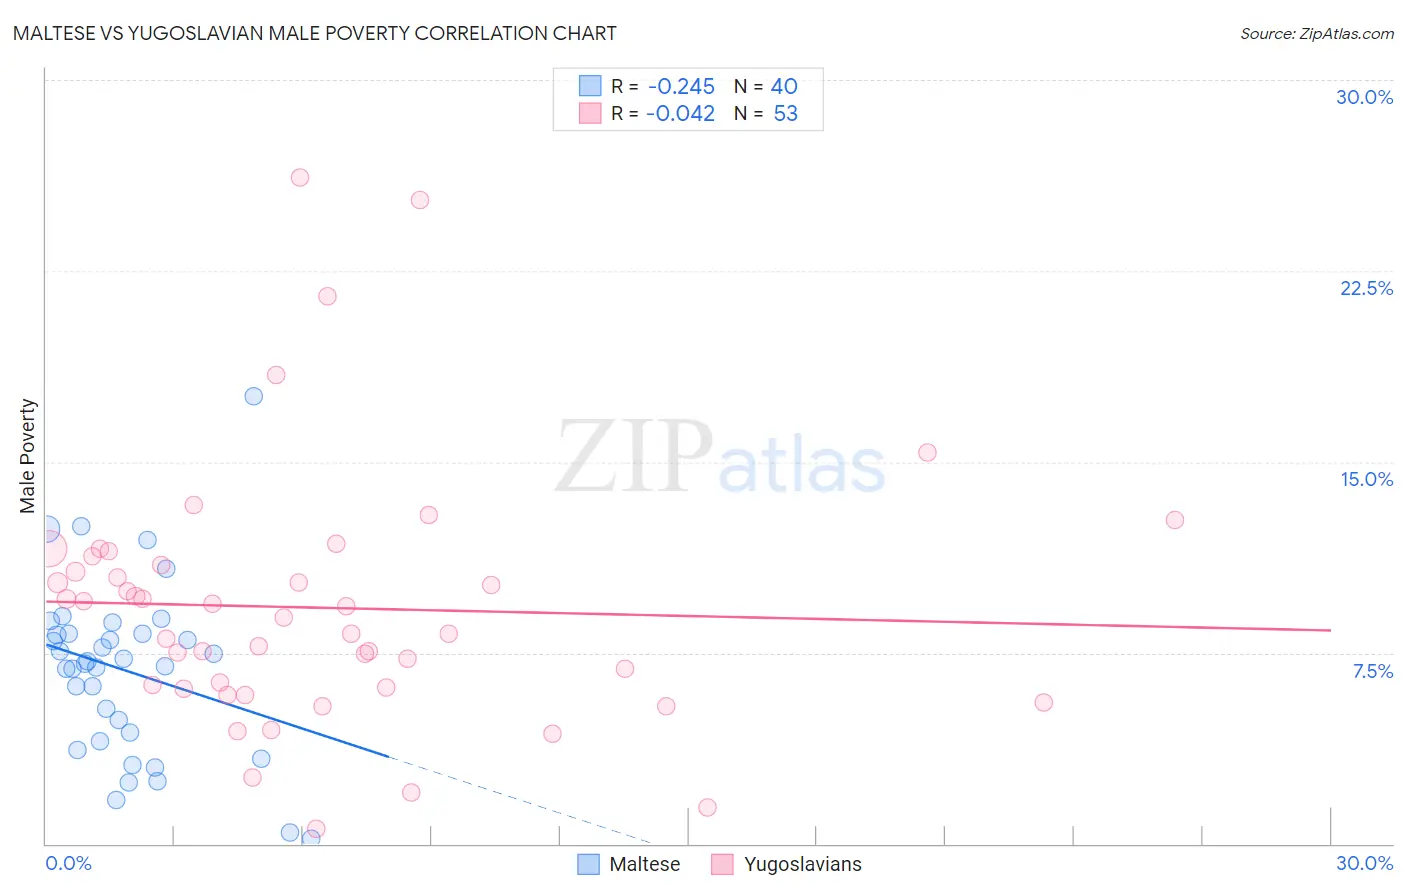
Maltese vs Yugoslavian Male Poverty Correlation Chart
The statistical analysis conducted on geographies consisting of 126,413,393 people shows a weak negative correlation between the proportion of Maltese and poverty level among males in the United States with a correlation coefficient (R) of -0.245 and weighted average of 9.1%. Similarly, the statistical analysis conducted on geographies consisting of 285,576,958 people shows no correlation between the proportion of Yugoslavians and poverty level among males in the United States with a correlation coefficient (R) of -0.042 and weighted average of 10.8%, a difference of 19.5%.
Male Poverty Correlation Summary
| Measurement | Maltese | Yugoslavian |
| Minimum | 0.22% | 0.59% |
| Maximum | 17.6% | 26.2% |
| Range | 17.3% | 25.6% |
| Mean | 6.8% | 9.3% |
| Median | 7.1% | 8.9% |
| Interquartile 25% (IQ1) | 4.2% | 6.1% |
| Interquartile 75% (IQ3) | 8.3% | 11.1% |
| Interquartile Range (IQR) | 4.1% | 5.0% |
| Standard Deviation (Sample) | 3.5% | 5.1% |
| Standard Deviation (Population) | 3.4% | 5.0% |
Similar Demographics by Male Poverty
Demographics Similar to Maltese by Male Poverty
In terms of male poverty, the demographic groups most similar to Maltese are Assyrian/Chaldean/Syriac (9.1%, a difference of 0.66%), Immigrants from Ireland (9.1%, a difference of 0.75%), Filipino (9.2%, a difference of 1.4%), Immigrants from Taiwan (8.9%, a difference of 2.0%), and Immigrants from South Central Asia (9.3%, a difference of 2.2%).
| Demographics | Rating | Rank | Male Poverty |
| Immigrants | India | 100.0 /100 | #1 | Exceptional 8.2% |
| Chinese | 100.0 /100 | #2 | Exceptional 8.7% |
| Thais | 100.0 /100 | #3 | Exceptional 8.7% |
| Immigrants | Taiwan | 100.0 /100 | #4 | Exceptional 8.9% |
| Maltese | 100.0 /100 | #5 | Exceptional 9.1% |
| Assyrians/Chaldeans/Syriacs | 99.9 /100 | #6 | Exceptional 9.1% |
| Immigrants | Ireland | 99.9 /100 | #7 | Exceptional 9.1% |
| Filipinos | 99.9 /100 | #8 | Exceptional 9.2% |
| Immigrants | South Central Asia | 99.9 /100 | #9 | Exceptional 9.3% |
| Bulgarians | 99.9 /100 | #10 | Exceptional 9.3% |
| Bolivians | 99.9 /100 | #11 | Exceptional 9.4% |
| Immigrants | Bolivia | 99.9 /100 | #12 | Exceptional 9.4% |
| Immigrants | Lithuania | 99.9 /100 | #13 | Exceptional 9.4% |
| Immigrants | North Macedonia | 99.8 /100 | #14 | Exceptional 9.4% |
| Bhutanese | 99.8 /100 | #15 | Exceptional 9.5% |
Demographics Similar to Yugoslavians by Male Poverty
In terms of male poverty, the demographic groups most similar to Yugoslavians are Immigrants from Jordan (10.8%, a difference of 0.12%), Immigrants from Switzerland (10.8%, a difference of 0.15%), Tlingit-Haida (10.9%, a difference of 0.31%), Immigrants from France (10.9%, a difference of 0.34%), and Immigrants from Israel (10.8%, a difference of 0.42%).
| Demographics | Rating | Rank | Male Poverty |
| Immigrants | Belarus | 83.3 /100 | #131 | Excellent 10.7% |
| Immigrants | Vietnam | 83.0 /100 | #132 | Excellent 10.8% |
| Pakistanis | 83.0 /100 | #133 | Excellent 10.8% |
| New Zealanders | 82.9 /100 | #134 | Excellent 10.8% |
| Brazilians | 82.7 /100 | #135 | Excellent 10.8% |
| Immigrants | Israel | 80.9 /100 | #136 | Excellent 10.8% |
| Immigrants | Switzerland | 79.2 /100 | #137 | Good 10.8% |
| Yugoslavians | 78.2 /100 | #138 | Good 10.8% |
| Immigrants | Jordan | 77.5 /100 | #139 | Good 10.8% |
| Tlingit-Haida | 76.1 /100 | #140 | Good 10.9% |
| Immigrants | France | 75.8 /100 | #141 | Good 10.9% |
| Basques | 74.6 /100 | #142 | Good 10.9% |
| Afghans | 71.9 /100 | #143 | Good 10.9% |
| Samoans | 71.8 /100 | #144 | Good 10.9% |
| Immigrants | Germany | 71.6 /100 | #145 | Good 10.9% |