Maltese vs Immigrants from Belize Male Poverty
COMPARE
Maltese
Immigrants from Belize
Male Poverty
Male Poverty Comparison
Maltese
Immigrants from Belize
9.1%
MALE POVERTY
100.0/ 100
METRIC RATING
5th/ 347
METRIC RANK
13.8%
MALE POVERTY
0.0/ 100
METRIC RATING
293rd/ 347
METRIC RANK
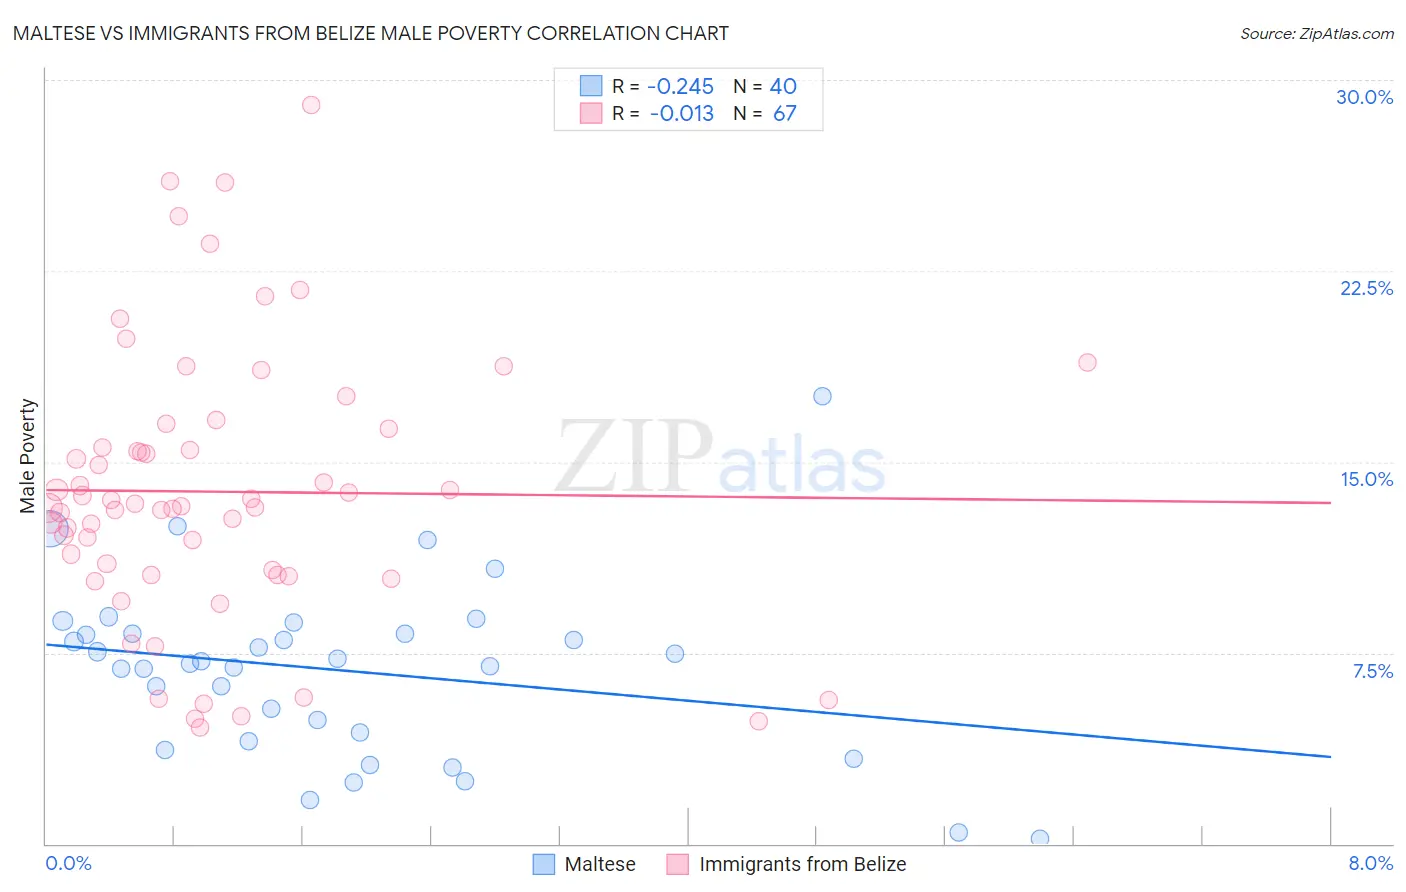
Maltese vs Immigrants from Belize Male Poverty Correlation Chart
The statistical analysis conducted on geographies consisting of 126,413,393 people shows a weak negative correlation between the proportion of Maltese and poverty level among males in the United States with a correlation coefficient (R) of -0.245 and weighted average of 9.1%. Similarly, the statistical analysis conducted on geographies consisting of 130,288,128 people shows no correlation between the proportion of Immigrants from Belize and poverty level among males in the United States with a correlation coefficient (R) of -0.013 and weighted average of 13.8%, a difference of 52.6%.
Male Poverty Correlation Summary
| Measurement | Maltese | Immigrants from Belize |
| Minimum | 0.22% | 4.6% |
| Maximum | 17.6% | 29.0% |
| Range | 17.3% | 24.4% |
| Mean | 6.8% | 13.8% |
| Median | 7.1% | 13.2% |
| Interquartile 25% (IQ1) | 4.2% | 10.6% |
| Interquartile 75% (IQ3) | 8.3% | 16.3% |
| Interquartile Range (IQR) | 4.1% | 5.7% |
| Standard Deviation (Sample) | 3.5% | 5.4% |
| Standard Deviation (Population) | 3.4% | 5.3% |
Similar Demographics by Male Poverty
Demographics Similar to Maltese by Male Poverty
In terms of male poverty, the demographic groups most similar to Maltese are Assyrian/Chaldean/Syriac (9.1%, a difference of 0.66%), Immigrants from Ireland (9.1%, a difference of 0.75%), Filipino (9.2%, a difference of 1.4%), Immigrants from Taiwan (8.9%, a difference of 2.0%), and Immigrants from South Central Asia (9.3%, a difference of 2.2%).
| Demographics | Rating | Rank | Male Poverty |
| Immigrants | India | 100.0 /100 | #1 | Exceptional 8.2% |
| Chinese | 100.0 /100 | #2 | Exceptional 8.7% |
| Thais | 100.0 /100 | #3 | Exceptional 8.7% |
| Immigrants | Taiwan | 100.0 /100 | #4 | Exceptional 8.9% |
| Maltese | 100.0 /100 | #5 | Exceptional 9.1% |
| Assyrians/Chaldeans/Syriacs | 99.9 /100 | #6 | Exceptional 9.1% |
| Immigrants | Ireland | 99.9 /100 | #7 | Exceptional 9.1% |
| Filipinos | 99.9 /100 | #8 | Exceptional 9.2% |
| Immigrants | South Central Asia | 99.9 /100 | #9 | Exceptional 9.3% |
| Bulgarians | 99.9 /100 | #10 | Exceptional 9.3% |
| Bolivians | 99.9 /100 | #11 | Exceptional 9.4% |
| Immigrants | Bolivia | 99.9 /100 | #12 | Exceptional 9.4% |
| Immigrants | Lithuania | 99.9 /100 | #13 | Exceptional 9.4% |
| Immigrants | North Macedonia | 99.8 /100 | #14 | Exceptional 9.4% |
| Bhutanese | 99.8 /100 | #15 | Exceptional 9.5% |
Demographics Similar to Immigrants from Belize by Male Poverty
In terms of male poverty, the demographic groups most similar to Immigrants from Belize are Indonesian (13.8%, a difference of 0.010%), Hispanic or Latino (13.9%, a difference of 0.060%), Vietnamese (13.8%, a difference of 0.18%), Guatemalan (13.8%, a difference of 0.27%), and Immigrants from Zaire (13.8%, a difference of 0.27%).
| Demographics | Rating | Rank | Male Poverty |
| Shoshone | 0.0 /100 | #286 | Tragic 13.8% |
| Immigrants | Barbados | 0.0 /100 | #287 | Tragic 13.8% |
| Immigrants | St. Vincent and the Grenadines | 0.0 /100 | #288 | Tragic 13.8% |
| Guatemalans | 0.0 /100 | #289 | Tragic 13.8% |
| Immigrants | Zaire | 0.0 /100 | #290 | Tragic 13.8% |
| Vietnamese | 0.0 /100 | #291 | Tragic 13.8% |
| Indonesians | 0.0 /100 | #292 | Tragic 13.8% |
| Immigrants | Belize | 0.0 /100 | #293 | Tragic 13.8% |
| Hispanics or Latinos | 0.0 /100 | #294 | Tragic 13.9% |
| Immigrants | Central America | 0.0 /100 | #295 | Tragic 13.9% |
| Cajuns | 0.0 /100 | #296 | Tragic 13.9% |
| Inupiat | 0.0 /100 | #297 | Tragic 14.0% |
| Blackfeet | 0.0 /100 | #298 | Tragic 14.0% |
| Immigrants | Guatemala | 0.0 /100 | #299 | Tragic 14.0% |
| Immigrants | Mexico | 0.0 /100 | #300 | Tragic 14.0% |