Maltese vs Immigrants from Fiji Male Poverty
COMPARE
Maltese
Immigrants from Fiji
Male Poverty
Male Poverty Comparison
Maltese
Immigrants from Fiji
9.1%
MALE POVERTY
100.0/ 100
METRIC RATING
5th/ 347
METRIC RANK
11.2%
MALE POVERTY
46.0/ 100
METRIC RATING
176th/ 347
METRIC RANK
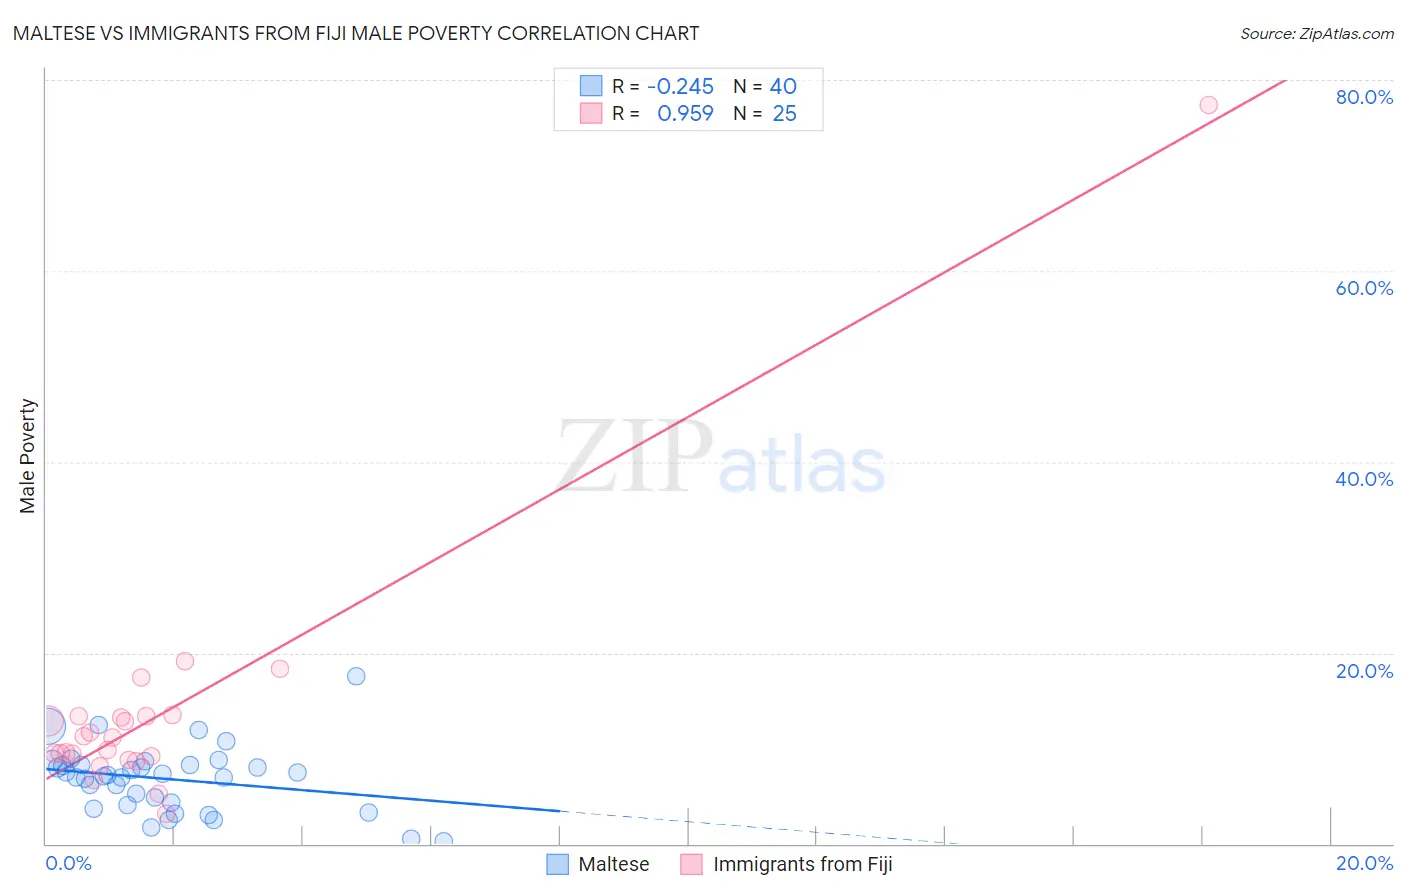
Maltese vs Immigrants from Fiji Male Poverty Correlation Chart
The statistical analysis conducted on geographies consisting of 126,413,393 people shows a weak negative correlation between the proportion of Maltese and poverty level among males in the United States with a correlation coefficient (R) of -0.245 and weighted average of 9.1%. Similarly, the statistical analysis conducted on geographies consisting of 93,752,822 people shows a perfect positive correlation between the proportion of Immigrants from Fiji and poverty level among males in the United States with a correlation coefficient (R) of 0.959 and weighted average of 11.2%, a difference of 23.8%.
Male Poverty Correlation Summary
| Measurement | Maltese | Immigrants from Fiji |
| Minimum | 0.22% | 3.1% |
| Maximum | 17.6% | 77.3% |
| Range | 17.3% | 74.2% |
| Mean | 6.8% | 13.7% |
| Median | 7.1% | 11.1% |
| Interquartile 25% (IQ1) | 4.2% | 9.0% |
| Interquartile 75% (IQ3) | 8.3% | 13.4% |
| Interquartile Range (IQR) | 4.1% | 4.4% |
| Standard Deviation (Sample) | 3.5% | 13.8% |
| Standard Deviation (Population) | 3.4% | 13.5% |
Similar Demographics by Male Poverty
Demographics Similar to Maltese by Male Poverty
In terms of male poverty, the demographic groups most similar to Maltese are Assyrian/Chaldean/Syriac (9.1%, a difference of 0.66%), Immigrants from Ireland (9.1%, a difference of 0.75%), Filipino (9.2%, a difference of 1.4%), Immigrants from Taiwan (8.9%, a difference of 2.0%), and Immigrants from South Central Asia (9.3%, a difference of 2.2%).
| Demographics | Rating | Rank | Male Poverty |
| Immigrants | India | 100.0 /100 | #1 | Exceptional 8.2% |
| Chinese | 100.0 /100 | #2 | Exceptional 8.7% |
| Thais | 100.0 /100 | #3 | Exceptional 8.7% |
| Immigrants | Taiwan | 100.0 /100 | #4 | Exceptional 8.9% |
| Maltese | 100.0 /100 | #5 | Exceptional 9.1% |
| Assyrians/Chaldeans/Syriacs | 99.9 /100 | #6 | Exceptional 9.1% |
| Immigrants | Ireland | 99.9 /100 | #7 | Exceptional 9.1% |
| Filipinos | 99.9 /100 | #8 | Exceptional 9.2% |
| Immigrants | South Central Asia | 99.9 /100 | #9 | Exceptional 9.3% |
| Bulgarians | 99.9 /100 | #10 | Exceptional 9.3% |
| Bolivians | 99.9 /100 | #11 | Exceptional 9.4% |
| Immigrants | Bolivia | 99.9 /100 | #12 | Exceptional 9.4% |
| Immigrants | Lithuania | 99.9 /100 | #13 | Exceptional 9.4% |
| Immigrants | North Macedonia | 99.8 /100 | #14 | Exceptional 9.4% |
| Bhutanese | 99.8 /100 | #15 | Exceptional 9.5% |
Demographics Similar to Immigrants from Fiji by Male Poverty
In terms of male poverty, the demographic groups most similar to Immigrants from Fiji are Lebanese (11.2%, a difference of 0.040%), Celtic (11.2%, a difference of 0.14%), Immigrants from Cameroon (11.2%, a difference of 0.15%), Immigrants from Oceania (11.2%, a difference of 0.39%), and Pennsylvania German (11.2%, a difference of 0.44%).
| Demographics | Rating | Rank | Male Poverty |
| Immigrants | Colombia | 54.2 /100 | #169 | Average 11.1% |
| South Americans | 53.8 /100 | #170 | Average 11.1% |
| Uruguayans | 51.0 /100 | #171 | Average 11.2% |
| Immigrants | Ethiopia | 50.7 /100 | #172 | Average 11.2% |
| Pennsylvania Germans | 50.5 /100 | #173 | Average 11.2% |
| Immigrants | Oceania | 50.0 /100 | #174 | Average 11.2% |
| Celtics | 47.5 /100 | #175 | Average 11.2% |
| Immigrants | Fiji | 46.0 /100 | #176 | Average 11.2% |
| Lebanese | 45.6 /100 | #177 | Average 11.2% |
| Immigrants | Cameroon | 44.5 /100 | #178 | Average 11.2% |
| Immigrants | Syria | 40.3 /100 | #179 | Average 11.3% |
| Immigrants | Morocco | 40.1 /100 | #180 | Average 11.3% |
| Immigrants | Costa Rica | 39.5 /100 | #181 | Fair 11.3% |
| Mongolians | 39.0 /100 | #182 | Fair 11.3% |
| Kenyans | 38.4 /100 | #183 | Fair 11.3% |