Liberian vs Immigrants from Western Europe Female Poverty
COMPARE
Liberian
Immigrants from Western Europe
Female Poverty
Female Poverty Comparison
Liberians
Immigrants from Western Europe
15.4%
FEMALE POVERTY
0.2/ 100
METRIC RATING
253rd/ 347
METRIC RANK
12.8%
FEMALE POVERTY
86.6/ 100
METRIC RATING
133rd/ 347
METRIC RANK
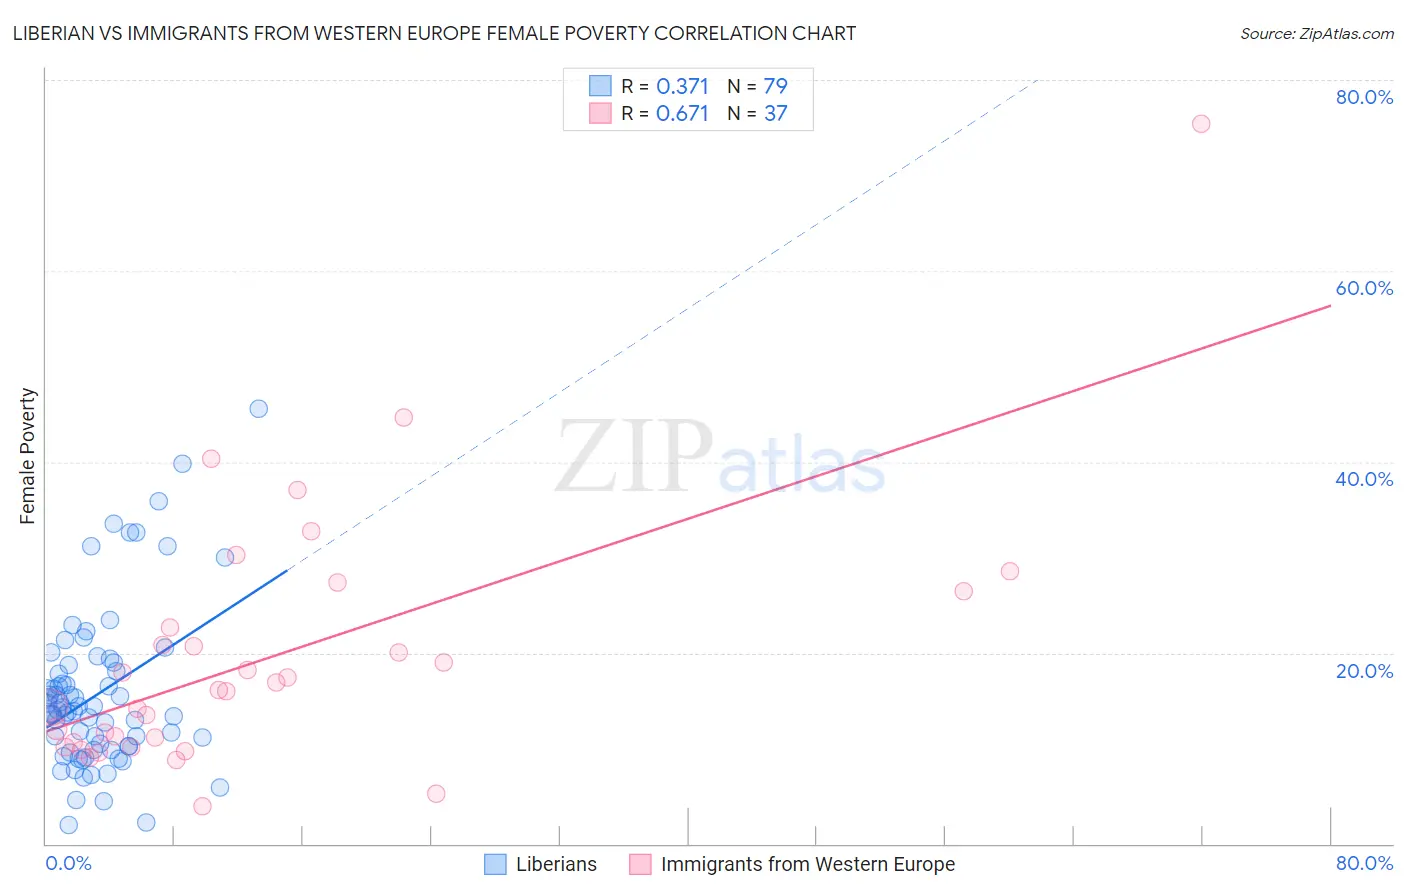
Liberian vs Immigrants from Western Europe Female Poverty Correlation Chart
The statistical analysis conducted on geographies consisting of 118,038,056 people shows a mild positive correlation between the proportion of Liberians and poverty level among females in the United States with a correlation coefficient (R) of 0.371 and weighted average of 15.4%. Similarly, the statistical analysis conducted on geographies consisting of 493,604,679 people shows a significant positive correlation between the proportion of Immigrants from Western Europe and poverty level among females in the United States with a correlation coefficient (R) of 0.671 and weighted average of 12.8%, a difference of 20.0%.
Female Poverty Correlation Summary
| Measurement | Liberian | Immigrants from Western Europe |
| Minimum | 1.9% | 4.0% |
| Maximum | 45.5% | 75.4% |
| Range | 43.6% | 71.4% |
| Mean | 15.7% | 19.6% |
| Median | 14.0% | 16.1% |
| Interquartile 25% (IQ1) | 10.2% | 10.4% |
| Interquartile 75% (IQ3) | 18.8% | 24.5% |
| Interquartile Range (IQR) | 8.6% | 14.2% |
| Standard Deviation (Sample) | 8.4% | 13.5% |
| Standard Deviation (Population) | 8.3% | 13.4% |
Similar Demographics by Female Poverty
Demographics Similar to Liberians by Female Poverty
In terms of female poverty, the demographic groups most similar to Liberians are Trinidadian and Tobagonian (15.4%, a difference of 0.24%), Immigrants from Burma/Myanmar (15.4%, a difference of 0.26%), Immigrants from Trinidad and Tobago (15.4%, a difference of 0.30%), Immigrants from Western Africa (15.3%, a difference of 0.45%), and Salvadoran (15.3%, a difference of 0.50%).
| Demographics | Rating | Rank | Female Poverty |
| Cubans | 0.3 /100 | #246 | Tragic 15.3% |
| Potawatomi | 0.3 /100 | #247 | Tragic 15.3% |
| Immigrants | Ghana | 0.3 /100 | #248 | Tragic 15.3% |
| Salvadorans | 0.3 /100 | #249 | Tragic 15.3% |
| Immigrants | Western Africa | 0.3 /100 | #250 | Tragic 15.3% |
| Immigrants | Trinidad and Tobago | 0.3 /100 | #251 | Tragic 15.4% |
| Immigrants | Burma/Myanmar | 0.3 /100 | #252 | Tragic 15.4% |
| Liberians | 0.2 /100 | #253 | Tragic 15.4% |
| Trinidadians and Tobagonians | 0.2 /100 | #254 | Tragic 15.4% |
| Ottawa | 0.2 /100 | #255 | Tragic 15.5% |
| Jamaicans | 0.2 /100 | #256 | Tragic 15.5% |
| Immigrants | Jamaica | 0.1 /100 | #257 | Tragic 15.6% |
| Shoshone | 0.1 /100 | #258 | Tragic 15.6% |
| Cape Verdeans | 0.1 /100 | #259 | Tragic 15.6% |
| Immigrants | Guyana | 0.1 /100 | #260 | Tragic 15.6% |
Demographics Similar to Immigrants from Western Europe by Female Poverty
In terms of female poverty, the demographic groups most similar to Immigrants from Western Europe are Immigrants from Jordan (12.8%, a difference of 0.060%), Immigrants from Argentina (12.8%, a difference of 0.070%), Immigrants from Vietnam (12.8%, a difference of 0.11%), Immigrants from Switzerland (12.9%, a difference of 0.16%), and French (12.9%, a difference of 0.22%).
| Demographics | Rating | Rank | Female Poverty |
| Immigrants | Ukraine | 88.8 /100 | #126 | Excellent 12.8% |
| South Africans | 88.4 /100 | #127 | Excellent 12.8% |
| Immigrants | Belarus | 88.2 /100 | #128 | Excellent 12.8% |
| Immigrants | Brazil | 87.9 /100 | #129 | Excellent 12.8% |
| Immigrants | Vietnam | 87.1 /100 | #130 | Excellent 12.8% |
| Immigrants | Argentina | 87.0 /100 | #131 | Excellent 12.8% |
| Immigrants | Jordan | 86.9 /100 | #132 | Excellent 12.8% |
| Immigrants | Western Europe | 86.6 /100 | #133 | Excellent 12.8% |
| Immigrants | Switzerland | 85.8 /100 | #134 | Excellent 12.9% |
| French | 85.6 /100 | #135 | Excellent 12.9% |
| Peruvians | 85.2 /100 | #136 | Excellent 12.9% |
| Chileans | 84.7 /100 | #137 | Excellent 12.9% |
| Immigrants | France | 83.6 /100 | #138 | Excellent 12.9% |
| Basques | 83.1 /100 | #139 | Excellent 12.9% |
| Pakistanis | 83.0 /100 | #140 | Excellent 12.9% |