Liberian vs Immigrants from Western Europe College, 1 year or more
COMPARE
Liberian
Immigrants from Western Europe
College, 1 year or more
College, 1 year or more Comparison
Liberians
Immigrants from Western Europe
56.7%
COLLEGE, 1 YEAR OR MORE
3.1/ 100
METRIC RATING
230th/ 347
METRIC RANK
62.7%
COLLEGE, 1 YEAR OR MORE
98.6/ 100
METRIC RATING
86th/ 347
METRIC RANK
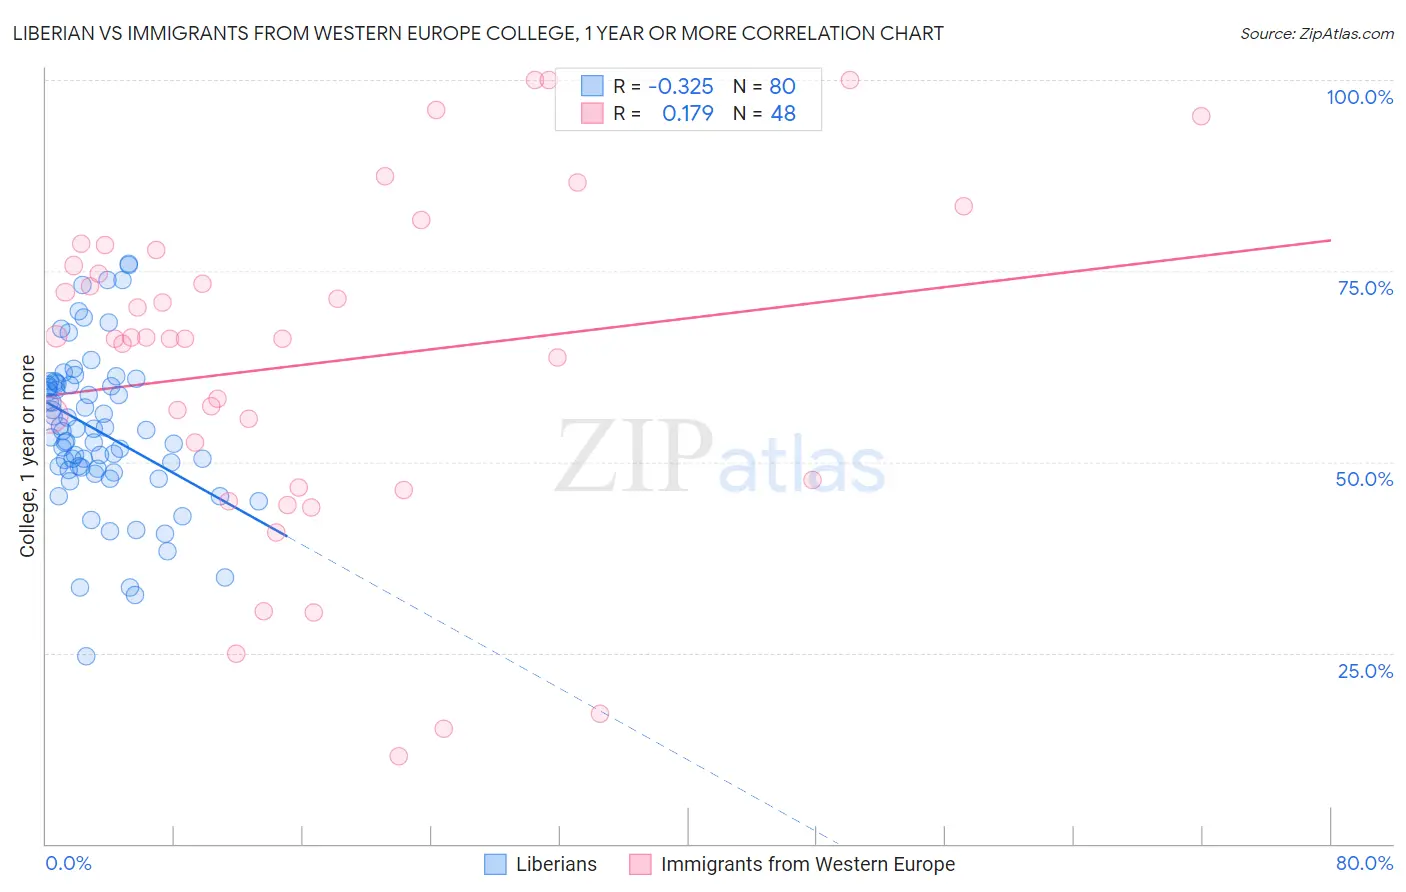
Liberian vs Immigrants from Western Europe College, 1 year or more Correlation Chart
The statistical analysis conducted on geographies consisting of 118,103,458 people shows a mild negative correlation between the proportion of Liberians and percentage of population with at least college, 1 year or more education in the United States with a correlation coefficient (R) of -0.325 and weighted average of 56.7%. Similarly, the statistical analysis conducted on geographies consisting of 494,075,353 people shows a poor positive correlation between the proportion of Immigrants from Western Europe and percentage of population with at least college, 1 year or more education in the United States with a correlation coefficient (R) of 0.179 and weighted average of 62.7%, a difference of 10.7%.
College, 1 year or more Correlation Summary
| Measurement | Liberian | Immigrants from Western Europe |
| Minimum | 24.5% | 11.4% |
| Maximum | 75.9% | 100.0% |
| Range | 51.4% | 88.6% |
| Mean | 54.1% | 62.9% |
| Median | 54.1% | 66.2% |
| Interquartile 25% (IQ1) | 49.0% | 47.2% |
| Interquartile 75% (IQ3) | 60.1% | 76.8% |
| Interquartile Range (IQR) | 11.1% | 29.6% |
| Standard Deviation (Sample) | 10.2% | 22.1% |
| Standard Deviation (Population) | 10.1% | 21.9% |
Similar Demographics by College, 1 year or more
Demographics Similar to Liberians by College, 1 year or more
In terms of college, 1 year or more, the demographic groups most similar to Liberians are Immigrants from Burma/Myanmar (56.6%, a difference of 0.19%), Cree (56.8%, a difference of 0.22%), Immigrants from Bangladesh (56.6%, a difference of 0.25%), Nonimmigrants (56.5%, a difference of 0.34%), and Immigrants from Fiji (56.9%, a difference of 0.35%).
| Demographics | Rating | Rank | College, 1 year or more |
| Portuguese | 5.4 /100 | #223 | Tragic 57.2% |
| Hmong | 5.4 /100 | #224 | Tragic 57.2% |
| Vietnamese | 4.7 /100 | #225 | Tragic 57.0% |
| Immigrants | Western Africa | 4.6 /100 | #226 | Tragic 57.0% |
| Immigrants | Immigrants | 4.4 /100 | #227 | Tragic 57.0% |
| Immigrants | Fiji | 4.0 /100 | #228 | Tragic 56.9% |
| Cree | 3.6 /100 | #229 | Tragic 56.8% |
| Liberians | 3.1 /100 | #230 | Tragic 56.7% |
| Immigrants | Burma/Myanmar | 2.7 /100 | #231 | Tragic 56.6% |
| Immigrants | Bangladesh | 2.6 /100 | #232 | Tragic 56.6% |
| Immigrants | Nonimmigrants | 2.5 /100 | #233 | Tragic 56.5% |
| Spanish Americans | 1.8 /100 | #234 | Tragic 56.3% |
| West Indians | 1.8 /100 | #235 | Tragic 56.3% |
| Iroquois | 1.7 /100 | #236 | Tragic 56.2% |
| Samoans | 1.6 /100 | #237 | Tragic 56.2% |
Demographics Similar to Immigrants from Western Europe by College, 1 year or more
In terms of college, 1 year or more, the demographic groups most similar to Immigrants from Western Europe are Immigrants from Pakistan (62.8%, a difference of 0.020%), Immigrants from Hungary (62.7%, a difference of 0.020%), Immigrants from England (62.8%, a difference of 0.030%), Immigrants from Argentina (62.8%, a difference of 0.060%), and Immigrants from Bolivia (62.8%, a difference of 0.10%).
| Demographics | Rating | Rank | College, 1 year or more |
| Northern Europeans | 98.8 /100 | #79 | Exceptional 62.9% |
| Lithuanians | 98.8 /100 | #80 | Exceptional 62.9% |
| Laotians | 98.7 /100 | #81 | Exceptional 62.8% |
| Immigrants | Bolivia | 98.7 /100 | #82 | Exceptional 62.8% |
| Immigrants | Argentina | 98.6 /100 | #83 | Exceptional 62.8% |
| Immigrants | England | 98.6 /100 | #84 | Exceptional 62.8% |
| Immigrants | Pakistan | 98.6 /100 | #85 | Exceptional 62.8% |
| Immigrants | Western Europe | 98.6 /100 | #86 | Exceptional 62.7% |
| Immigrants | Hungary | 98.6 /100 | #87 | Exceptional 62.7% |
| Greeks | 98.3 /100 | #88 | Exceptional 62.6% |
| Immigrants | Ethiopia | 98.2 /100 | #89 | Exceptional 62.6% |
| Immigrants | Western Asia | 97.9 /100 | #90 | Exceptional 62.5% |
| Immigrants | Eastern Europe | 97.8 /100 | #91 | Exceptional 62.4% |
| Immigrants | Egypt | 97.8 /100 | #92 | Exceptional 62.4% |
| Romanians | 97.7 /100 | #93 | Exceptional 62.4% |