Israeli vs Immigrants from Uruguay Single Mother Poverty
COMPARE
Israeli
Immigrants from Uruguay
Single Mother Poverty
Single Mother Poverty Comparison
Israelis
Immigrants from Uruguay
28.0%
SINGLE MOTHER POVERTY
96.5/ 100
METRIC RATING
105th/ 347
METRIC RANK
29.1%
SINGLE MOTHER POVERTY
57.2/ 100
METRIC RATING
169th/ 347
METRIC RANK
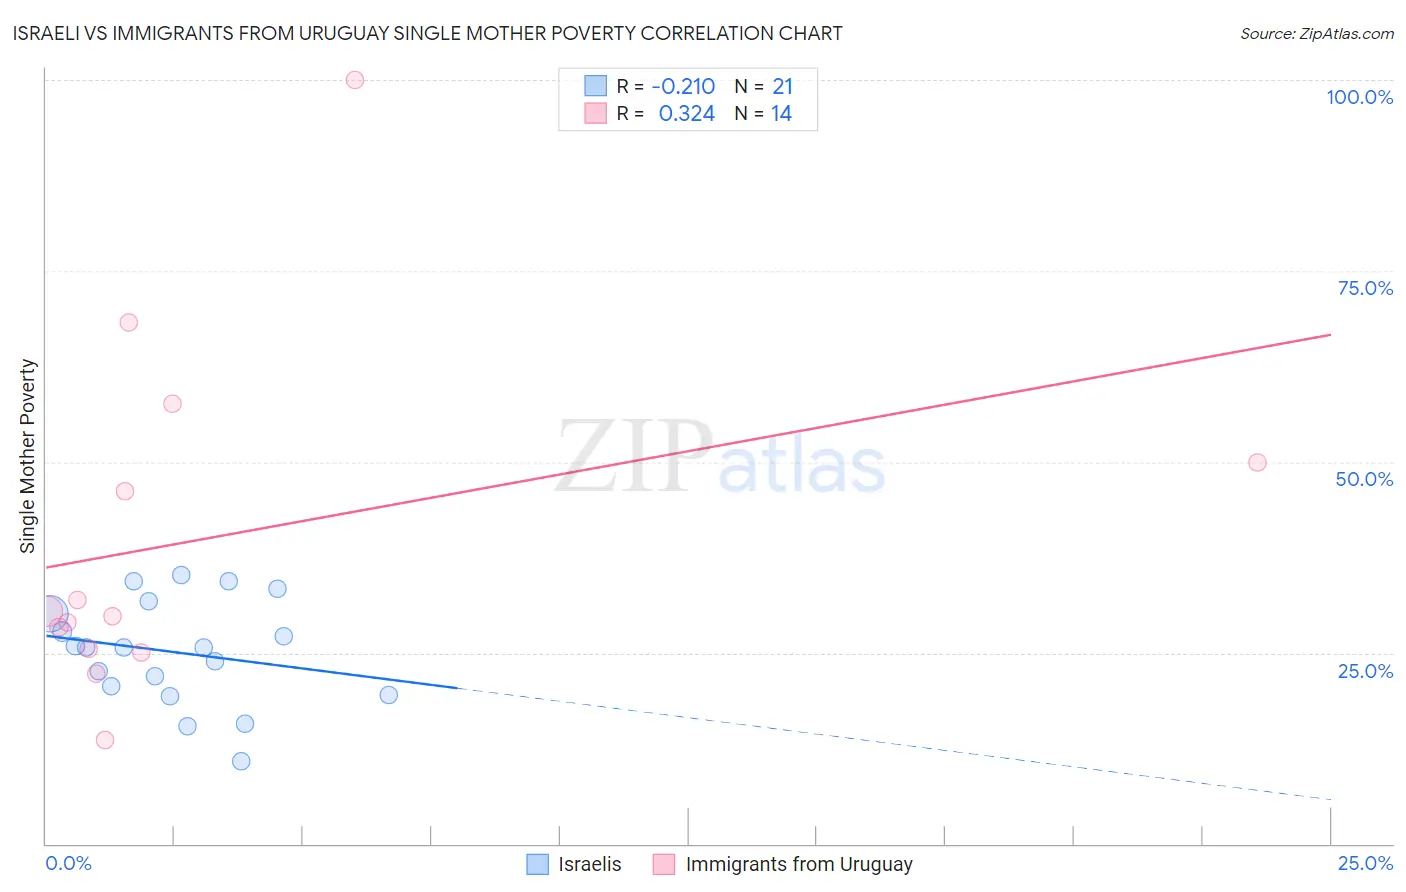
Israeli vs Immigrants from Uruguay Single Mother Poverty Correlation Chart
The statistical analysis conducted on geographies consisting of 207,028,427 people shows a weak negative correlation between the proportion of Israelis and poverty level among single mothers in the United States with a correlation coefficient (R) of -0.210 and weighted average of 28.0%. Similarly, the statistical analysis conducted on geographies consisting of 131,793,407 people shows a mild positive correlation between the proportion of Immigrants from Uruguay and poverty level among single mothers in the United States with a correlation coefficient (R) of 0.324 and weighted average of 29.1%, a difference of 3.8%.
Single Mother Poverty Correlation Summary
| Measurement | Israeli | Immigrants from Uruguay |
| Minimum | 10.8% | 13.7% |
| Maximum | 35.2% | 100.0% |
| Range | 24.4% | 86.3% |
| Mean | 25.1% | 39.9% |
| Median | 25.6% | 30.1% |
| Interquartile 25% (IQ1) | 20.1% | 25.6% |
| Interquartile 75% (IQ3) | 31.0% | 50.0% |
| Interquartile Range (IQR) | 10.9% | 24.4% |
| Standard Deviation (Sample) | 6.8% | 22.9% |
| Standard Deviation (Population) | 6.6% | 22.1% |
Similar Demographics by Single Mother Poverty
Demographics Similar to Israelis by Single Mother Poverty
In terms of single mother poverty, the demographic groups most similar to Israelis are Italian (28.0%, a difference of 0.020%), Immigrants from Northern Africa (28.0%, a difference of 0.040%), Ukrainian (28.0%, a difference of 0.040%), Immigrants from Croatia (28.0%, a difference of 0.060%), and Pakistani (28.0%, a difference of 0.16%).
| Demographics | Rating | Rank | Single Mother Poverty |
| Immigrants | Nepal | 97.2 /100 | #98 | Exceptional 27.9% |
| Immigrants | Netherlands | 97.2 /100 | #99 | Exceptional 27.9% |
| Zimbabweans | 97.1 /100 | #100 | Exceptional 27.9% |
| Pakistanis | 96.9 /100 | #101 | Exceptional 28.0% |
| Immigrants | Croatia | 96.7 /100 | #102 | Exceptional 28.0% |
| Immigrants | Northern Africa | 96.6 /100 | #103 | Exceptional 28.0% |
| Italians | 96.6 /100 | #104 | Exceptional 28.0% |
| Israelis | 96.5 /100 | #105 | Exceptional 28.0% |
| Ukrainians | 96.4 /100 | #106 | Exceptional 28.0% |
| Immigrants | Venezuela | 95.8 /100 | #107 | Exceptional 28.1% |
| Immigrants | Zimbabwe | 95.5 /100 | #108 | Exceptional 28.1% |
| Immigrants | Armenia | 95.2 /100 | #109 | Exceptional 28.1% |
| Croatians | 94.8 /100 | #110 | Exceptional 28.2% |
| Venezuelans | 94.5 /100 | #111 | Exceptional 28.2% |
| Immigrants | Kazakhstan | 94.5 /100 | #112 | Exceptional 28.2% |
Demographics Similar to Immigrants from Uruguay by Single Mother Poverty
In terms of single mother poverty, the demographic groups most similar to Immigrants from Uruguay are European (29.1%, a difference of 0.020%), Costa Rican (29.0%, a difference of 0.060%), New Zealander (29.1%, a difference of 0.10%), Puget Sound Salish (29.1%, a difference of 0.11%), and Inupiat (29.0%, a difference of 0.16%).
| Demographics | Rating | Rank | Single Mother Poverty |
| Scandinavians | 66.2 /100 | #162 | Good 28.9% |
| Immigrants | Nigeria | 65.9 /100 | #163 | Good 28.9% |
| Immigrants | Kenya | 65.9 /100 | #164 | Good 28.9% |
| Arabs | 60.7 /100 | #165 | Good 29.0% |
| Inupiat | 60.4 /100 | #166 | Good 29.0% |
| Costa Ricans | 58.4 /100 | #167 | Average 29.0% |
| Europeans | 57.6 /100 | #168 | Average 29.1% |
| Immigrants | Uruguay | 57.2 /100 | #169 | Average 29.1% |
| New Zealanders | 55.1 /100 | #170 | Average 29.1% |
| Puget Sound Salish | 55.1 /100 | #171 | Average 29.1% |
| Carpatho Rusyns | 53.8 /100 | #172 | Average 29.1% |
| British | 50.6 /100 | #173 | Average 29.2% |
| Immigrants | Saudi Arabia | 50.0 /100 | #174 | Average 29.2% |
| Immigrants | Costa Rica | 48.8 /100 | #175 | Average 29.2% |
| Hawaiians | 47.8 /100 | #176 | Average 29.2% |