Israeli vs Immigrants from Uruguay Disability Age Over 75
COMPARE
Israeli
Immigrants from Uruguay
Disability Age Over 75
Disability Age Over 75 Comparison
Israelis
Immigrants from Uruguay
46.4%
DISABILITY AGE OVER 75
97.0/ 100
METRIC RATING
104th/ 347
METRIC RANK
46.4%
DISABILITY AGE OVER 75
96.7/ 100
METRIC RATING
107th/ 347
METRIC RANK
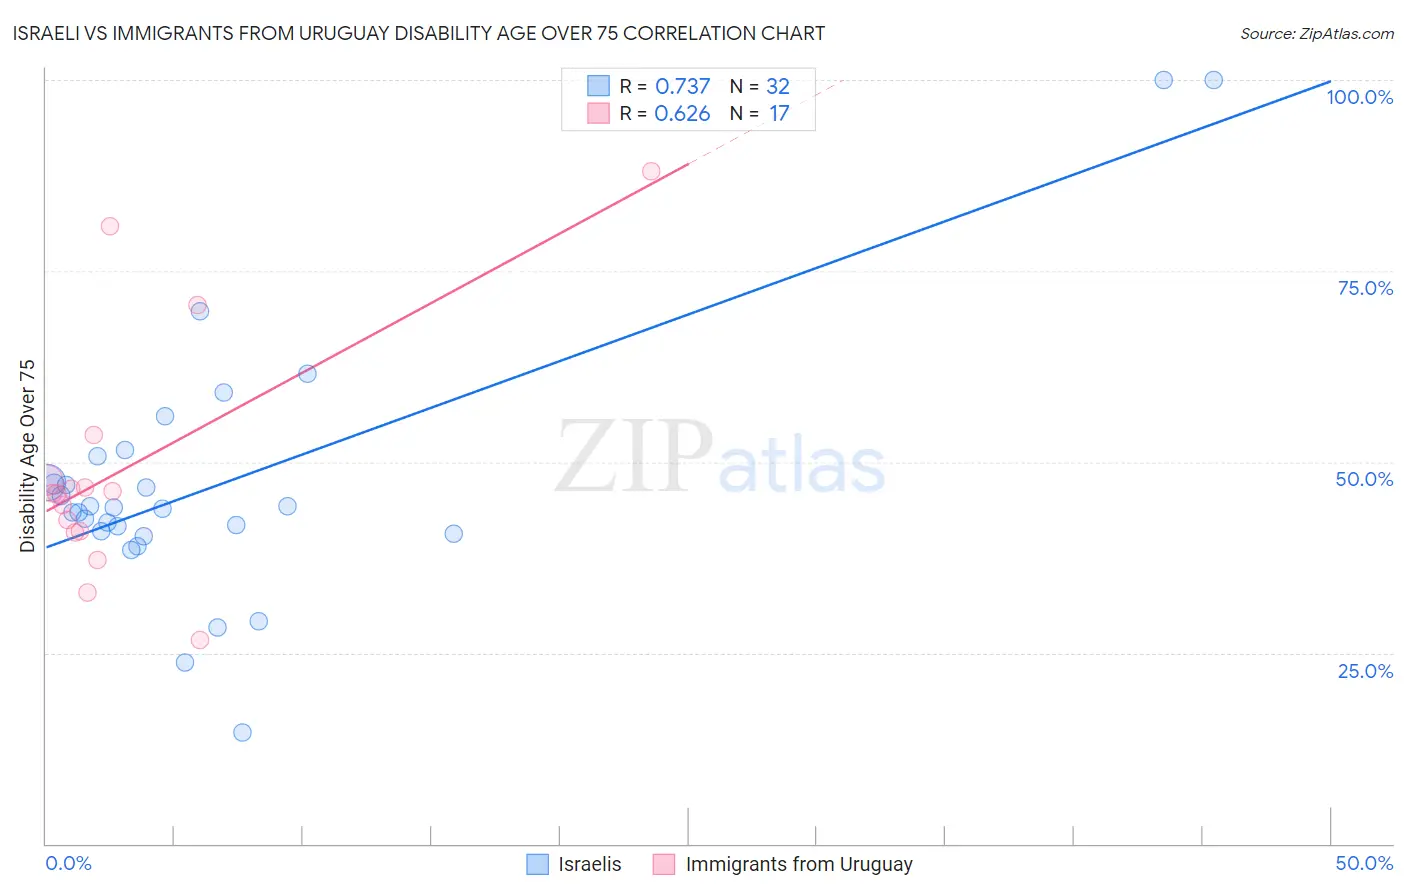
Israeli vs Immigrants from Uruguay Disability Age Over 75 Correlation Chart
The statistical analysis conducted on geographies consisting of 210,857,618 people shows a strong positive correlation between the proportion of Israelis and percentage of population with a disability over the age of 75 in the United States with a correlation coefficient (R) of 0.737 and weighted average of 46.4%. Similarly, the statistical analysis conducted on geographies consisting of 133,242,093 people shows a significant positive correlation between the proportion of Immigrants from Uruguay and percentage of population with a disability over the age of 75 in the United States with a correlation coefficient (R) of 0.626 and weighted average of 46.4%, a difference of 0.070%.
Disability Age Over 75 Correlation Summary
| Measurement | Israeli | Immigrants from Uruguay |
| Minimum | 14.6% | 26.7% |
| Maximum | 100.0% | 88.0% |
| Range | 85.4% | 61.3% |
| Mean | 47.1% | 49.2% |
| Median | 44.0% | 45.9% |
| Interquartile 25% (IQ1) | 40.7% | 40.9% |
| Interquartile 75% (IQ3) | 49.0% | 50.6% |
| Interquartile Range (IQR) | 8.3% | 9.7% |
| Standard Deviation (Sample) | 17.3% | 16.1% |
| Standard Deviation (Population) | 17.0% | 15.6% |
Demographics Similar to Israelis and Immigrants from Uruguay by Disability Age Over 75
In terms of disability age over 75, the demographic groups most similar to Israelis are Immigrants from Malaysia (46.4%, a difference of 0.020%), Ukrainian (46.4%, a difference of 0.020%), Immigrants from Cameroon (46.4%, a difference of 0.020%), Immigrants from Kuwait (46.4%, a difference of 0.040%), and Brazilian (46.5%, a difference of 0.080%). Similarly, the demographic groups most similar to Immigrants from Uruguay are Brazilian (46.5%, a difference of 0.010%), Immigrants from Kuwait (46.4%, a difference of 0.030%), Chilean (46.5%, a difference of 0.040%), Immigrants from Cameroon (46.4%, a difference of 0.050%), and Immigrants from Hong Kong (46.5%, a difference of 0.050%).
| Demographics | Rating | Rank | Disability Age Over 75 |
| Immigrants | Brazil | 98.0 /100 | #95 | Exceptional 46.3% |
| Immigrants | China | 98.0 /100 | #96 | Exceptional 46.3% |
| Finns | 97.9 /100 | #97 | Exceptional 46.3% |
| Immigrants | Japan | 97.8 /100 | #98 | Exceptional 46.3% |
| Palestinians | 97.7 /100 | #99 | Exceptional 46.3% |
| Immigrants | Eastern Europe | 97.7 /100 | #100 | Exceptional 46.3% |
| Mongolians | 97.7 /100 | #101 | Exceptional 46.3% |
| Immigrants | Malaysia | 97.1 /100 | #102 | Exceptional 46.4% |
| Ukrainians | 97.1 /100 | #103 | Exceptional 46.4% |
| Israelis | 97.0 /100 | #104 | Exceptional 46.4% |
| Immigrants | Cameroon | 96.9 /100 | #105 | Exceptional 46.4% |
| Immigrants | Kuwait | 96.8 /100 | #106 | Exceptional 46.4% |
| Immigrants | Uruguay | 96.7 /100 | #107 | Exceptional 46.4% |
| Brazilians | 96.6 /100 | #108 | Exceptional 46.5% |
| Chileans | 96.4 /100 | #109 | Exceptional 46.5% |
| Immigrants | Hong Kong | 96.4 /100 | #110 | Exceptional 46.5% |
| Immigrants | Chile | 96.4 /100 | #111 | Exceptional 46.5% |
| Immigrants | Pakistan | 96.1 /100 | #112 | Exceptional 46.5% |
| Irish | 96.0 /100 | #113 | Exceptional 46.5% |
| Dutch | 95.9 /100 | #114 | Exceptional 46.5% |
| British | 95.7 /100 | #115 | Exceptional 46.5% |