Iraqi vs Immigrants from China Family Poverty

COMPARE

Iraqi
Race
Ancestry
AfghanAfricanAlaska NativeAlaskan AthabascanAlbanianAleutAlsatianAmericanApacheArabArapahoArgentineanArmenianAssyrian/Chaldean/SyriacAustralianAustrianBahamianBangladeshiBarbadianBasqueBelgianBelizeanBermudanBhutaneseBlackfeetBolivianBrazilianBritishBritish West IndianBulgarianBurmeseCajunCambodianCanadianCape VerdeanCarpatho RusynCelticCentral AmericanCentral American IndianCherokeeCheyenneChickasawChileanChineseChippewaChoctawColombianColvilleComancheCosta RicanCreeCreekCroatianCrowCubanCypriotCzechCzechoslovakianDanishDelawareDominicanDutchDutch West IndianEastern EuropeanEcuadorianEgyptianEnglishEstonianEthiopianEuropeanFijianFilipinoFinnishFrenchFrench American IndianFrench CanadianGermanGerman RussianGhanaianGreekGuamanian/ChamorroGuatemalanGuyaneseHaitianHmongHonduranHopiHoumaHungarianIcelanderIndian (Asian)IndonesianInupiatIranianIraqiIrishIroquoisIsraeliItalianJamaicanJapaneseJordanianKenyanKiowaKoreanLaotianLatvianLebaneseLiberianLithuanianLumbeeLuxembourgerMacedonianMalaysianMalteseMarshalleseMenomineeMexicanMexican American IndianMongolianMoroccanNative HawaiianNavajoNepaleseNew ZealanderNicaraguanNigerianNorthern EuropeanNorwegianOkinawanOsageOttawaPaiutePakistaniPalestinianPanamanianParaguayanPennsylvania GermanPeruvianPimaPolishPortuguesePotawatomiPuebloPuerto RicanPuget Sound SalishRomanianRussianSalvadoranSamoanScandinavianScotch-IrishScottishSeminoleSenegaleseSerbianShoshoneSierra LeoneanSiouxSlavicSlovakSloveneSomaliSouth AfricanSouth AmericanSouth American IndianSoviet UnionSpaniardSpanishSpanish AmericanSpanish American IndianSri LankanSubsaharan AfricanSudaneseSwedishSwissSyrianTaiwaneseThaiTlingit-HaidaTohono O'OdhamTonganTrinidadian and TobagonianTsimshianTurkishU.S. Virgin IslanderUgandanUkrainianUruguayanUteVenezuelanVietnameseWelshWest IndianYakamaYaquiYugoslavianYumanYup'ikZimbabwean
Immigration
NonimmigrantsImmigrantsAfghanistanAfricaAlbaniaArgentinaArmeniaAsiaAustraliaAustriaBahamasBangladeshBarbadosBelarusBelgiumBelizeBoliviaBosnia and HerzegovinaBrazilBulgariaBurma/MyanmarCabo VerdeCambodiaCameroonCanadaCaribbeanCentral AmericaChileColombiaCongoCosta RicaCroatiaCubaCzechoslovakiaDenmarkDominicaDominican RepublicEastern AfricaEastern AsiaEastern EuropeEcuadorEgyptEl SalvadorEnglandEritreaEthiopiaEuropeFijiFranceGermanyGhanaGreeceGrenadaGuatemalaGuyanaHaitiHondurasHong KongHungaryIndiaIndonesiaIranIraqIrelandIsraelItalyJamaicaJapanJordanKazakhstanKenyaKoreaKuwaitLaosLatin AmericaLatviaLebanonLiberiaLithuaniaMalaysiaMexicoMicronesiaMiddle AfricaMoldovaMoroccoNepalNetherlandsNicaraguaNigeriaNorth AmericaNorth MacedoniaNorthern AfricaNorthern EuropeNorwayOceaniaPakistanPanamaPeruPhilippinesPolandPortugalRomaniaRussiaSaudi ArabiaScotlandSenegalSerbiaSierra LeoneSingaporeSomaliaSouth AfricaSouth AmericaSouth Central AsiaSouth Eastern AsiaSouthern EuropeSpainSri LankaSt. Vincent and the GrenadinesSudanSwedenSwitzerlandSyriaTaiwanThailandTrinidad and TobagoTurkeyUgandaUkraineUruguayUzbekistanVenezuelaVietnamWest IndiesWestern AfricaWestern AsiaWestern EuropeYemenZaireZimbabweAzores
Immigrants from China
Race
Ancestry
AfghanAfricanAlaska NativeAlaskan AthabascanAlbanianAleutAlsatianAmericanApacheArabArapahoArgentineanArmenianAssyrian/Chaldean/SyriacAustralianAustrianBahamianBangladeshiBarbadianBasqueBelgianBelizeanBermudanBhutaneseBlackfeetBolivianBrazilianBritishBritish West IndianBulgarianBurmeseCajunCambodianCanadianCape VerdeanCarpatho RusynCelticCentral AmericanCentral American IndianCherokeeCheyenneChickasawChileanChineseChippewaChoctawColombianColvilleComancheCosta RicanCreeCreekCroatianCrowCubanCypriotCzechCzechoslovakianDanishDelawareDominicanDutchDutch West IndianEastern EuropeanEcuadorianEgyptianEnglishEstonianEthiopianEuropeanFijianFilipinoFinnishFrenchFrench American IndianFrench CanadianGermanGerman RussianGhanaianGreekGuamanian/ChamorroGuatemalanGuyaneseHaitianHmongHonduranHopiHoumaHungarianIcelanderIndian (Asian)IndonesianInupiatIranianIrishIroquoisIsraeliItalianJamaicanJapaneseJordanianKenyanKiowaKoreanLaotianLatvianLebaneseLiberianLithuanianLumbeeLuxembourgerMacedonianMalaysianMalteseMarshalleseMenomineeMexicanMexican American IndianMongolianMoroccanNative HawaiianNavajoNepaleseNew ZealanderNicaraguanNigerianNorthern EuropeanNorwegianOkinawanOsageOttawaPaiutePakistaniPalestinianPanamanianParaguayanPennsylvania GermanPeruvianPimaPolishPortuguesePotawatomiPuebloPuerto RicanPuget Sound SalishRomanianRussianSalvadoranSamoanScandinavianScotch-IrishScottishSeminoleSenegaleseSerbianShoshoneSierra LeoneanSiouxSlavicSlovakSloveneSomaliSouth AfricanSouth AmericanSouth American IndianSoviet UnionSpaniardSpanishSpanish AmericanSpanish American IndianSri LankanSubsaharan AfricanSudaneseSwedishSwissSyrianTaiwaneseThaiTlingit-HaidaTohono O'OdhamTonganTrinidadian and TobagonianTsimshianTurkishU.S. Virgin IslanderUgandanUkrainianUruguayanUteVenezuelanVietnameseWelshWest IndianYakamaYaquiYugoslavianYumanYup'ikZimbabwean
Immigration
NonimmigrantsImmigrantsAfghanistanAfricaAlbaniaArgentinaArmeniaAsiaAustraliaAustriaBahamasBangladeshBarbadosBelarusBelgiumBelizeBoliviaBosnia and HerzegovinaBrazilBulgariaBurma/MyanmarCabo VerdeCambodiaCameroonCanadaCaribbeanCentral AmericaChileChinaColombiaCongoCosta RicaCroatiaCubaCzechoslovakiaDenmarkDominicaDominican RepublicEastern AfricaEastern AsiaEastern EuropeEcuadorEgyptEl SalvadorEnglandEritreaEthiopiaEuropeFijiFranceGermanyGhanaGreeceGrenadaGuatemalaGuyanaHaitiHondurasHong KongHungaryIndiaIndonesiaIranIraqIrelandIsraelItalyJamaicaJapanJordanKazakhstanKenyaKoreaKuwaitLaosLatin AmericaLatviaLebanonLiberiaLithuaniaMalaysiaMexicoMicronesiaMiddle AfricaMoldovaMoroccoNepalNetherlandsNicaraguaNigeriaNorth AmericaNorth MacedoniaNorthern AfricaNorthern EuropeNorwayOceaniaPakistanPanamaPeruPhilippinesPolandPortugalRomaniaRussiaSaudi ArabiaScotlandSenegalSerbiaSierra LeoneSingaporeSomaliaSouth AfricaSouth AmericaSouth Central AsiaSouth Eastern AsiaSouthern EuropeSpainSri LankaSt. Vincent and the GrenadinesSudanSwedenSwitzerlandSyriaTaiwanThailandTrinidad and TobagoTurkeyUgandaUkraineUruguayUzbekistanVenezuelaVietnamWest IndiesWestern AfricaWestern AsiaWestern EuropeYemenZaireZimbabweAzores
Family Poverty
Income
Poverty
Unemployment
Labor Participation
Family Structure
Vehicle Availability
Education Level
Disability

Family Poverty Comparison

Iraqis

Immigrants from China

Fair
Exceptional
9.3%
FAMILY POVERTY
24.2/ 100
METRIC RATING
198th/ 347
METRIC RANK
7.8%
FAMILY POVERTY
98.1/ 100
METRIC RATING
74th/ 347
METRIC RANK

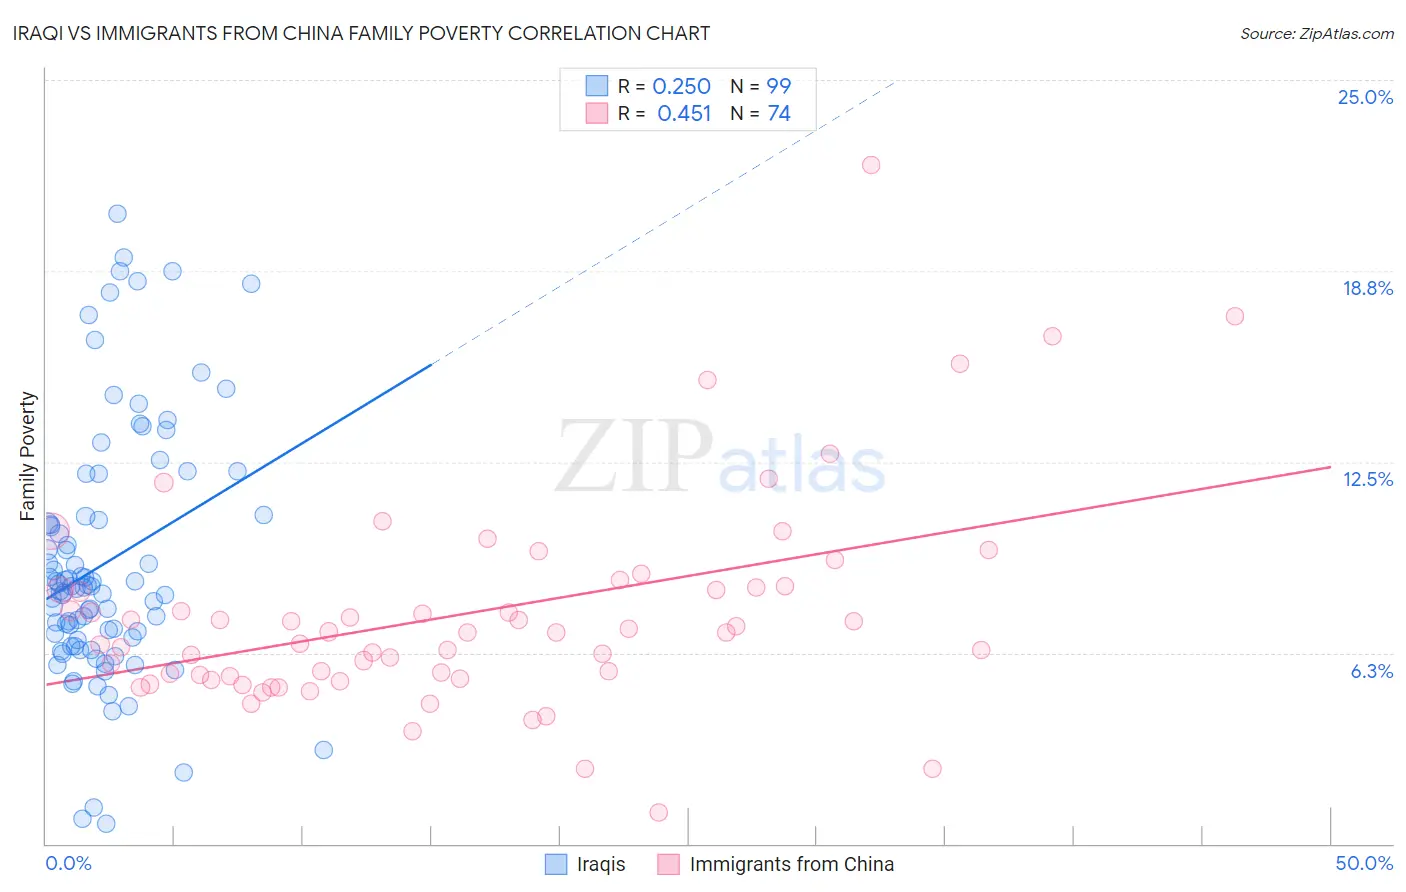
Iraqi vs Immigrants from China Family Poverty Correlation Chart

The statistical analysis conducted on geographies consisting of 170,433,754 people shows a weak positive correlation between the proportion of Iraqis and poverty level among families in the United States with a correlation coefficient (R) of 0.250 and weighted average of 9.3%. Similarly, the statistical analysis conducted on geographies consisting of 454,907,220 people shows a moderate positive correlation between the proportion of Immigrants from China and poverty level among families in the United States with a correlation coefficient (R) of 0.451 and weighted average of 7.8%, a difference of 19.2%.
Iraqi vs Immigrants from China Family Poverty

Family Poverty Correlation Summary

MeasurementIraqiImmigrants from China
Minimum0.67%1.0%
Maximum20.6%22.2%
Range19.9%21.2%
Mean9.2%7.5%
Median8.4%6.9%
Interquartile 25% (IQ1)6.7%5.5%
Interquartile 75% (IQ3)10.7%8.4%
Interquartile Range (IQR)4.1%2.9%
Standard Deviation (Sample)4.1%3.5%
Standard Deviation (Population)4.1%3.4%

Similar Demographics by Family Poverty

Demographics Similar to Iraqis by Family Poverty

In terms of family poverty, the demographic groups most similar to Iraqis are Immigrants from Colombia (9.3%, a difference of 0.030%), Spaniard (9.4%, a difference of 0.25%), Immigrants from Venezuela (9.3%, a difference of 0.32%), Immigrants from Costa Rica (9.4%, a difference of 0.44%), and Venezuelan (9.3%, a difference of 0.53%).
DemographicsRating | RankFamily Poverty
Ugandans
28.7
/100
|
#191
Fair
9.3%
Spanish
28.7
/100
|
#192
Fair
9.3%
Immigrants | Western Asia
28.2
/100
|
#193
Fair
9.3%
South Americans
28.1
/100
|
#194
Fair
9.3%
Venezuelans
27.4
/100
|
#195
Fair
9.3%
Immigrants | Venezuela
26.1
/100
|
#196
Fair
9.3%
Immigrants | Colombia
24.4
/100
|
#197
Fair
9.3%
Iraqis
24.2
/100
|
#198
Fair
9.3%
Spaniards
22.8
/100
|
#199
Fair
9.4%
Immigrants | Costa Rica
21.7
/100
|
#200
Fair
9.4%
Immigrants | Portugal
20.5
/100
|
#201
Fair
9.4%
Immigrants | Sierra Leone
19.6
/100
|
#202
Poor
9.4%
German Russians
19.4
/100
|
#203
Poor
9.4%
Immigrants | Lebanon
18.9
/100
|
#204
Poor
9.4%
Aleuts
18.0
/100
|
#205
Poor
9.5%

Demographics Similar to Immigrants from China by Family Poverty

In terms of family poverty, the demographic groups most similar to Immigrants from China are Austrian (7.8%, a difference of 0.070%), Immigrants from Romania (7.8%, a difference of 0.080%), Cambodian (7.8%, a difference of 0.14%), Immigrants from Croatia (7.8%, a difference of 0.14%), and Immigrants from Canada (7.8%, a difference of 0.16%).
DemographicsRating | RankFamily Poverty
Northern Europeans
98.3
/100
|
#67
Exceptional
7.8%
Australians
98.2
/100
|
#68
Exceptional
7.8%
Immigrants | Belgium
98.2
/100
|
#69
Exceptional
7.8%
Immigrants | Canada
98.2
/100
|
#70
Exceptional
7.8%
Cambodians
98.2
/100
|
#71
Exceptional
7.8%
Immigrants | Romania
98.2
/100
|
#72
Exceptional
7.8%
Austrians
98.2
/100
|
#73
Exceptional
7.8%
Immigrants | China
98.1
/100
|
#74
Exceptional
7.8%
Immigrants | Croatia
98.1
/100
|
#75
Exceptional
7.8%
Immigrants | Latvia
98.0
/100
|
#76
Exceptional
7.9%
Ukrainians
98.0
/100
|
#77
Exceptional
7.9%
Immigrants | North America
97.9
/100
|
#78
Exceptional
7.9%
Immigrants | Europe
97.8
/100
|
#79
Exceptional
7.9%
English
97.8
/100
|
#80
Exceptional
7.9%
Irish
97.8
/100
|
#81
Exceptional
7.9%