Immigrants from Guyana vs Subsaharan African Poverty
COMPARE
Immigrants from Guyana
Subsaharan African
Poverty
Poverty Comparison
Immigrants from Guyana
Sub-Saharan Africans
14.5%
POVERTY
0.1/ 100
METRIC RATING
265th/ 347
METRIC RANK
14.5%
POVERTY
0.1/ 100
METRIC RATING
268th/ 347
METRIC RANK
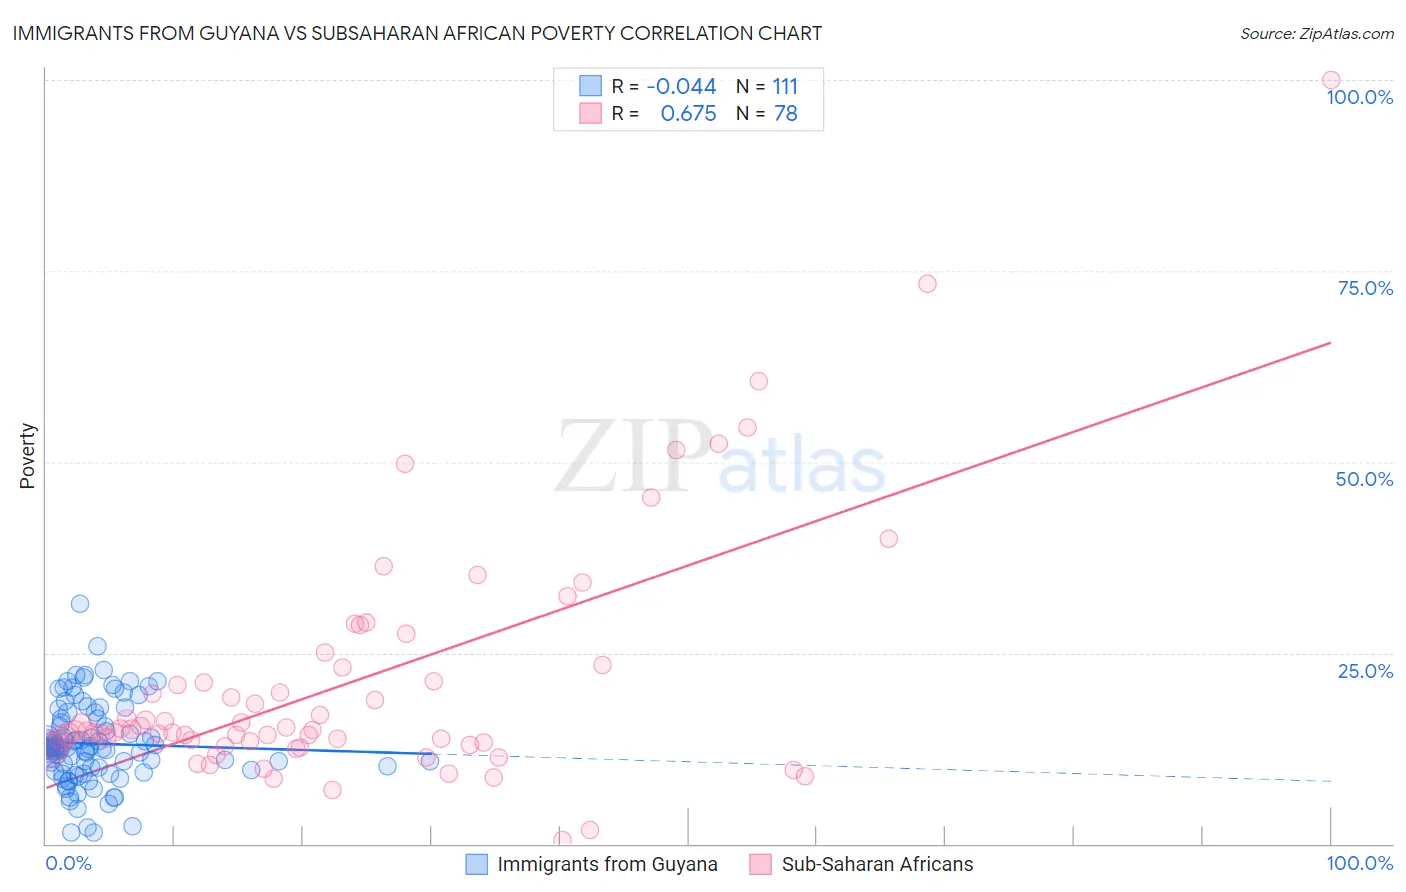
Immigrants from Guyana vs Subsaharan African Poverty Correlation Chart
The statistical analysis conducted on geographies consisting of 183,648,527 people shows no correlation between the proportion of Immigrants from Guyana and poverty level in the United States with a correlation coefficient (R) of -0.044 and weighted average of 14.5%. Similarly, the statistical analysis conducted on geographies consisting of 507,618,351 people shows a significant positive correlation between the proportion of Sub-Saharan Africans and poverty level in the United States with a correlation coefficient (R) of 0.675 and weighted average of 14.5%, a difference of 0.52%.
Poverty Correlation Summary
| Measurement | Immigrants from Guyana | Subsaharan African |
| Minimum | 1.4% | 0.57% |
| Maximum | 31.4% | 100.0% |
| Range | 30.0% | 99.4% |
| Mean | 13.1% | 21.1% |
| Median | 12.6% | 14.9% |
| Interquartile 25% (IQ1) | 10.0% | 12.9% |
| Interquartile 75% (IQ3) | 16.4% | 23.1% |
| Interquartile Range (IQR) | 6.4% | 10.2% |
| Standard Deviation (Sample) | 5.3% | 16.2% |
| Standard Deviation (Population) | 5.2% | 16.1% |
Demographics Similar to Immigrants from Guyana and Sub-Saharan Africans by Poverty
In terms of poverty, the demographic groups most similar to Immigrants from Guyana are Immigrants from Jamaica (14.4%, a difference of 0.13%), Guyanese (14.5%, a difference of 0.17%), Jamaican (14.4%, a difference of 0.21%), Iroquois (14.5%, a difference of 0.49%), and Immigrants from Liberia (14.4%, a difference of 0.56%). Similarly, the demographic groups most similar to Sub-Saharan Africans are Iroquois (14.5%, a difference of 0.040%), Immigrants from Cuba (14.6%, a difference of 0.15%), Central American (14.6%, a difference of 0.29%), Guyanese (14.5%, a difference of 0.35%), and Immigrants from Jamaica (14.4%, a difference of 0.65%).
| Demographics | Rating | Rank | Poverty |
| Mexican American Indians | 0.1 /100 | #256 | Tragic 14.3% |
| Trinidadians and Tobagonians | 0.1 /100 | #257 | Tragic 14.3% |
| Ottawa | 0.1 /100 | #258 | Tragic 14.3% |
| Immigrants | Nicaragua | 0.1 /100 | #259 | Tragic 14.3% |
| Cape Verdeans | 0.1 /100 | #260 | Tragic 14.4% |
| Cherokee | 0.1 /100 | #261 | Tragic 14.4% |
| Immigrants | Liberia | 0.1 /100 | #262 | Tragic 14.4% |
| Jamaicans | 0.1 /100 | #263 | Tragic 14.4% |
| Immigrants | Jamaica | 0.1 /100 | #264 | Tragic 14.4% |
| Immigrants | Guyana | 0.1 /100 | #265 | Tragic 14.5% |
| Guyanese | 0.1 /100 | #266 | Tragic 14.5% |
| Iroquois | 0.1 /100 | #267 | Tragic 14.5% |
| Sub-Saharan Africans | 0.1 /100 | #268 | Tragic 14.5% |
| Immigrants | Cuba | 0.1 /100 | #269 | Tragic 14.6% |
| Central Americans | 0.1 /100 | #270 | Tragic 14.6% |
| Shoshone | 0.0 /100 | #271 | Tragic 14.7% |
| Chickasaw | 0.0 /100 | #272 | Tragic 14.7% |
| Spanish Americans | 0.0 /100 | #273 | Tragic 14.7% |
| Barbadians | 0.0 /100 | #274 | Tragic 14.8% |
| Immigrants | West Indies | 0.0 /100 | #275 | Tragic 14.8% |
| Immigrants | Bahamas | 0.0 /100 | #276 | Tragic 14.8% |