Yup'ik vs Osage Female Poverty Among 18-24 Year Olds
COMPARE
Yup'ik
Osage
Female Poverty Among 18-24 Year Olds
Female Poverty Among 18-24 Year Olds Comparison
Yup'ik
Osage
27.0%
FEMALE POVERTY AMONG 18-24 YEAR OLDS
0.0/ 100
METRIC RATING
335th/ 347
METRIC RANK
24.5%
FEMALE POVERTY AMONG 18-24 YEAR OLDS
0.0/ 100
METRIC RATING
317th/ 347
METRIC RANK
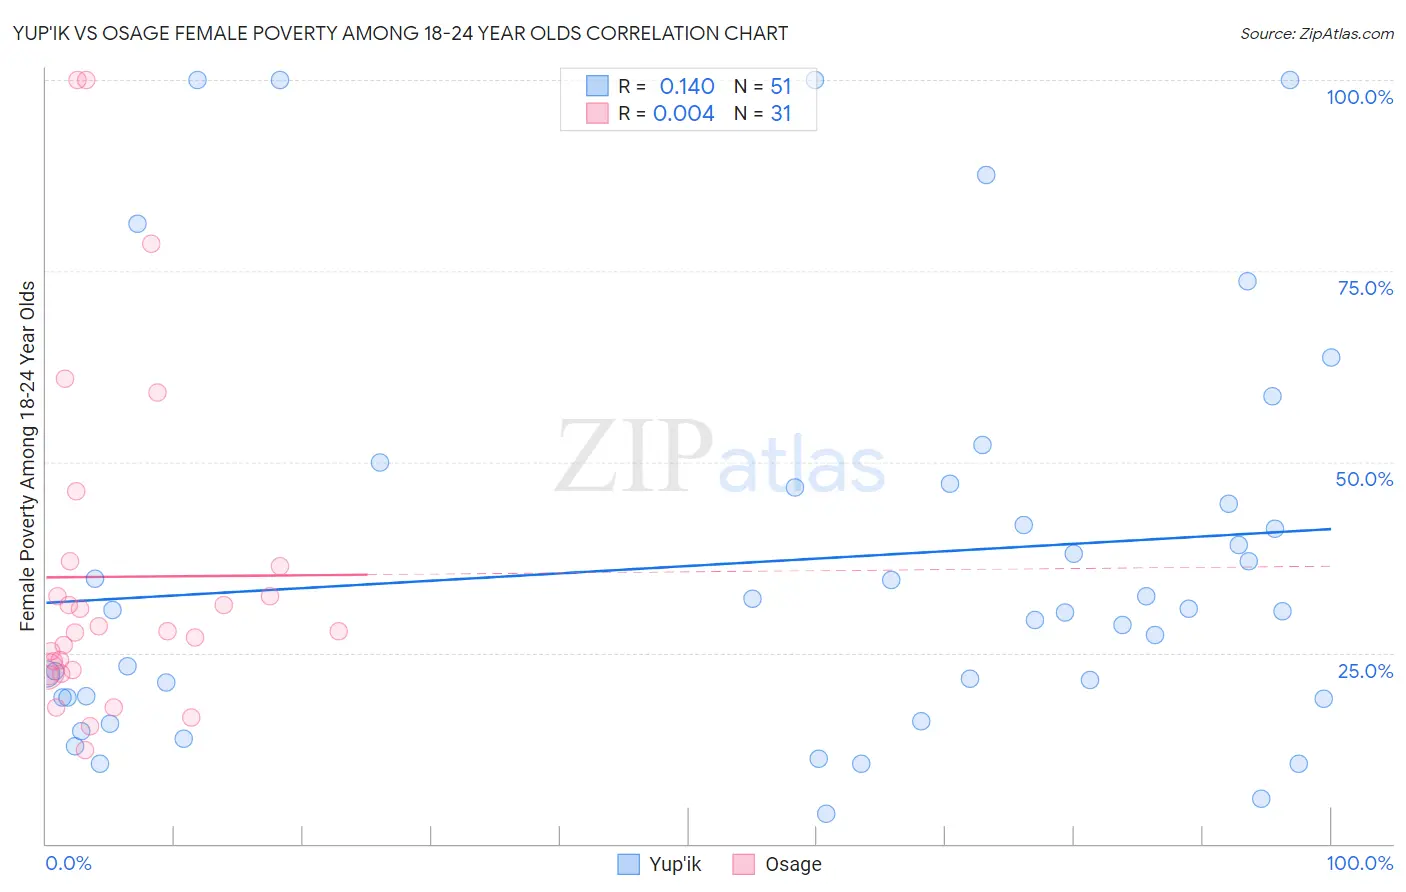
Yup'ik vs Osage Female Poverty Among 18-24 Year Olds Correlation Chart
The statistical analysis conducted on geographies consisting of 39,755,694 people shows a poor positive correlation between the proportion of Yup'ik and poverty level among females between the ages 18 and 24 in the United States with a correlation coefficient (R) of 0.140 and weighted average of 27.0%. Similarly, the statistical analysis conducted on geographies consisting of 91,241,953 people shows no correlation between the proportion of Osage and poverty level among females between the ages 18 and 24 in the United States with a correlation coefficient (R) of 0.004 and weighted average of 24.5%, a difference of 10.5%.
Female Poverty Among 18-24 Year Olds Correlation Summary
| Measurement | Yup'ik | Osage |
| Minimum | 4.0% | 12.3% |
| Maximum | 100.0% | 100.0% |
| Range | 96.0% | 87.7% |
| Mean | 36.8% | 35.0% |
| Median | 30.5% | 27.8% |
| Interquartile 25% (IQ1) | 19.2% | 22.6% |
| Interquartile 75% (IQ3) | 46.7% | 36.4% |
| Interquartile Range (IQR) | 27.5% | 13.7% |
| Standard Deviation (Sample) | 26.1% | 22.3% |
| Standard Deviation (Population) | 25.8% | 21.9% |
Demographics Similar to Yup'ik and Osage by Female Poverty Among 18-24 Year Olds
In terms of female poverty among 18-24 year olds, the demographic groups most similar to Yup'ik are Pueblo (26.9%, a difference of 0.45%), Immigrants from Yemen (27.5%, a difference of 1.9%), Apache (26.3%, a difference of 2.7%), Houma (26.2%, a difference of 3.2%), and Chippewa (25.9%, a difference of 4.3%). Similarly, the demographic groups most similar to Osage are Chickasaw (24.5%, a difference of 0.090%), Dutch West Indian (24.5%, a difference of 0.18%), Alsatian (24.4%, a difference of 0.29%), Immigrants from Congo (24.6%, a difference of 0.48%), and Immigrants from Zaire (25.1%, a difference of 2.5%).
| Demographics | Rating | Rank | Female Poverty Among 18-24 Year Olds |
| Alsatians | 0.0 /100 | #316 | Tragic 24.4% |
| Osage | 0.0 /100 | #317 | Tragic 24.5% |
| Chickasaw | 0.0 /100 | #318 | Tragic 24.5% |
| Dutch West Indians | 0.0 /100 | #319 | Tragic 24.5% |
| Immigrants | Congo | 0.0 /100 | #320 | Tragic 24.6% |
| Immigrants | Zaire | 0.0 /100 | #321 | Tragic 25.1% |
| Somalis | 0.0 /100 | #322 | Tragic 25.1% |
| Arapaho | 0.0 /100 | #323 | Tragic 25.2% |
| German Russians | 0.0 /100 | #324 | Tragic 25.2% |
| Immigrants | Saudi Arabia | 0.0 /100 | #325 | Tragic 25.3% |
| Yakama | 0.0 /100 | #326 | Tragic 25.3% |
| Ute | 0.0 /100 | #327 | Tragic 25.4% |
| Natives/Alaskans | 0.0 /100 | #328 | Tragic 25.4% |
| Cajuns | 0.0 /100 | #329 | Tragic 25.7% |
| Immigrants | Somalia | 0.0 /100 | #330 | Tragic 25.7% |
| Chippewa | 0.0 /100 | #331 | Tragic 25.9% |
| Houma | 0.0 /100 | #332 | Tragic 26.2% |
| Apache | 0.0 /100 | #333 | Tragic 26.3% |
| Pueblo | 0.0 /100 | #334 | Tragic 26.9% |
| Yup'ik | 0.0 /100 | #335 | Tragic 27.0% |
| Immigrants | Yemen | 0.0 /100 | #336 | Tragic 27.5% |