Immigrants from Uzbekistan vs Thai Receiving Food Stamps
COMPARE
Immigrants from Uzbekistan
Thai
Receiving Food Stamps
Receiving Food Stamps Comparison
Immigrants from Uzbekistan
Thais
14.3%
RECEIVING FOOD STAMPS
0.2/ 100
METRIC RATING
264th/ 347
METRIC RANK
8.1%
RECEIVING FOOD STAMPS
100.0/ 100
METRIC RATING
5th/ 347
METRIC RANK
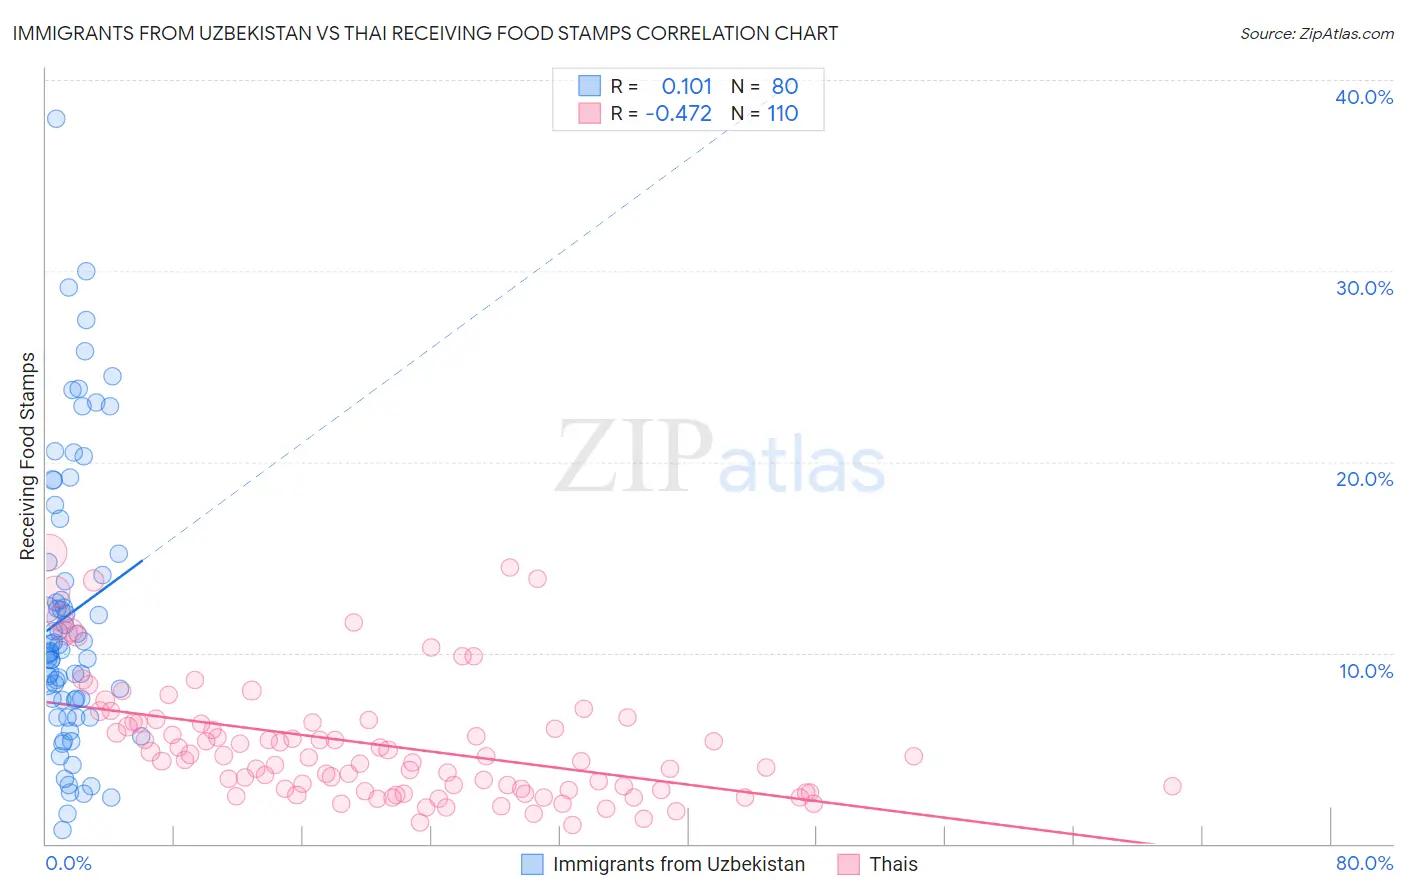
Immigrants from Uzbekistan vs Thai Receiving Food Stamps Correlation Chart
The statistical analysis conducted on geographies consisting of 118,563,262 people shows a poor positive correlation between the proportion of Immigrants from Uzbekistan and percentage of population receiving government assistance and/or food stamps in the United States with a correlation coefficient (R) of 0.101 and weighted average of 14.3%. Similarly, the statistical analysis conducted on geographies consisting of 473,754,114 people shows a moderate negative correlation between the proportion of Thais and percentage of population receiving government assistance and/or food stamps in the United States with a correlation coefficient (R) of -0.472 and weighted average of 8.1%, a difference of 75.9%.
Receiving Food Stamps Correlation Summary
| Measurement | Immigrants from Uzbekistan | Thai |
| Minimum | 0.70% | 1.0% |
| Maximum | 38.0% | 15.2% |
| Range | 37.3% | 14.2% |
| Mean | 12.1% | 5.2% |
| Median | 10.1% | 4.4% |
| Interquartile 25% (IQ1) | 7.5% | 2.8% |
| Interquartile 75% (IQ3) | 15.0% | 6.3% |
| Interquartile Range (IQR) | 7.4% | 3.5% |
| Standard Deviation (Sample) | 7.5% | 3.1% |
| Standard Deviation (Population) | 7.4% | 3.1% |
Similar Demographics by Receiving Food Stamps
Demographics Similar to Immigrants from Uzbekistan by Receiving Food Stamps
In terms of receiving food stamps, the demographic groups most similar to Immigrants from Uzbekistan are Blackfeet (14.3%, a difference of 0.050%), Immigrants from Portugal (14.3%, a difference of 0.090%), Paiute (14.3%, a difference of 0.10%), Cheyenne (14.3%, a difference of 0.14%), and Dutch West Indian (14.3%, a difference of 0.36%).
| Demographics | Rating | Rank | Receiving Food Stamps |
| Arapaho | 0.3 /100 | #257 | Tragic 14.1% |
| Immigrants | Ghana | 0.3 /100 | #258 | Tragic 14.1% |
| Creek | 0.3 /100 | #259 | Tragic 14.1% |
| Central Americans | 0.3 /100 | #260 | Tragic 14.1% |
| Immigrants | Congo | 0.3 /100 | #261 | Tragic 14.1% |
| Paiute | 0.2 /100 | #262 | Tragic 14.3% |
| Immigrants | Portugal | 0.2 /100 | #263 | Tragic 14.3% |
| Immigrants | Uzbekistan | 0.2 /100 | #264 | Tragic 14.3% |
| Blackfeet | 0.2 /100 | #265 | Tragic 14.3% |
| Cheyenne | 0.2 /100 | #266 | Tragic 14.3% |
| Dutch West Indians | 0.2 /100 | #267 | Tragic 14.3% |
| Guatemalans | 0.1 /100 | #268 | Tragic 14.4% |
| Nepalese | 0.1 /100 | #269 | Tragic 14.6% |
| Mexicans | 0.1 /100 | #270 | Tragic 14.6% |
| Immigrants | Guatemala | 0.1 /100 | #271 | Tragic 14.6% |
Demographics Similar to Thais by Receiving Food Stamps
In terms of receiving food stamps, the demographic groups most similar to Thais are Iranian (7.9%, a difference of 2.3%), Immigrants from Singapore (8.3%, a difference of 2.3%), Immigrants from Iran (8.3%, a difference of 2.9%), Burmese (8.6%, a difference of 6.6%), and Immigrants from Korea (8.7%, a difference of 6.8%).
| Demographics | Rating | Rank | Receiving Food Stamps |
| Immigrants | Taiwan | 100.0 /100 | #1 | Exceptional 7.3% |
| Immigrants | India | 100.0 /100 | #2 | Exceptional 7.4% |
| Filipinos | 100.0 /100 | #3 | Exceptional 7.4% |
| Iranians | 100.0 /100 | #4 | Exceptional 7.9% |
| Thais | 100.0 /100 | #5 | Exceptional 8.1% |
| Immigrants | Singapore | 100.0 /100 | #6 | Exceptional 8.3% |
| Immigrants | Iran | 100.0 /100 | #7 | Exceptional 8.3% |
| Burmese | 99.9 /100 | #8 | Exceptional 8.6% |
| Immigrants | Korea | 99.9 /100 | #9 | Exceptional 8.7% |
| Immigrants | South Central Asia | 99.9 /100 | #10 | Exceptional 8.8% |
| Okinawans | 99.9 /100 | #11 | Exceptional 8.9% |
| Cypriots | 99.9 /100 | #12 | Exceptional 8.9% |
| Bulgarians | 99.9 /100 | #13 | Exceptional 8.9% |
| Maltese | 99.9 /100 | #14 | Exceptional 8.9% |
| Norwegians | 99.9 /100 | #15 | Exceptional 9.0% |