Black/African American vs Thai Receiving Food Stamps
COMPARE
Black/African American
Thai
Receiving Food Stamps
Receiving Food Stamps Comparison
Blacks/African Americans
Thais
17.2%
RECEIVING FOOD STAMPS
0.0/ 100
METRIC RATING
317th/ 347
METRIC RANK
8.1%
RECEIVING FOOD STAMPS
100.0/ 100
METRIC RATING
5th/ 347
METRIC RANK
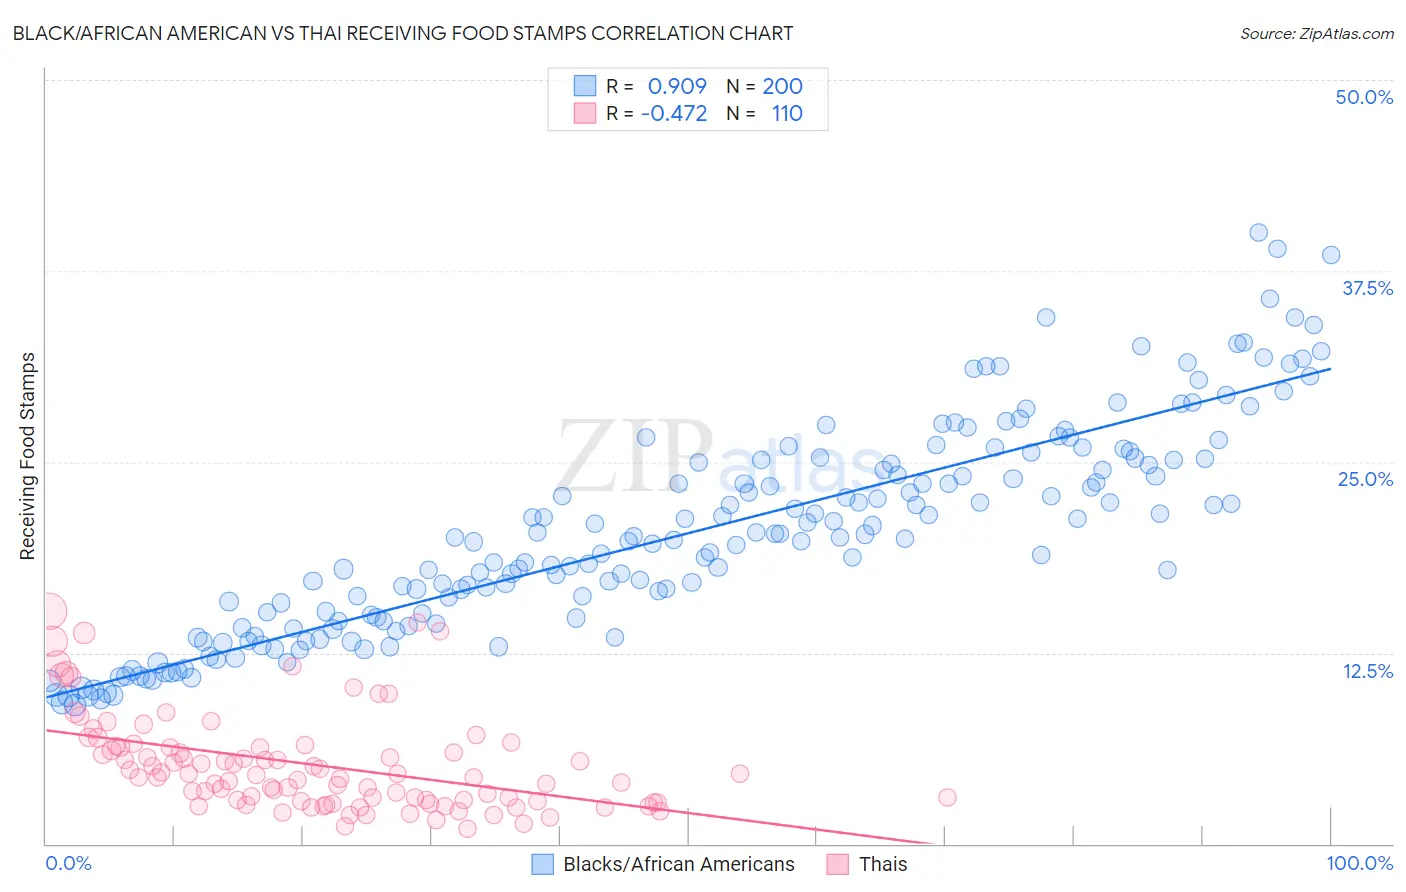
Black/African American vs Thai Receiving Food Stamps Correlation Chart
The statistical analysis conducted on geographies consisting of 562,963,519 people shows a near-perfect positive correlation between the proportion of Blacks/African Americans and percentage of population receiving government assistance and/or food stamps in the United States with a correlation coefficient (R) of 0.909 and weighted average of 17.2%. Similarly, the statistical analysis conducted on geographies consisting of 473,754,114 people shows a moderate negative correlation between the proportion of Thais and percentage of population receiving government assistance and/or food stamps in the United States with a correlation coefficient (R) of -0.472 and weighted average of 8.1%, a difference of 111.6%.
Receiving Food Stamps Correlation Summary
| Measurement | Black/African American | Thai |
| Minimum | 9.1% | 1.0% |
| Maximum | 40.0% | 15.2% |
| Range | 31.0% | 14.2% |
| Mean | 20.3% | 5.2% |
| Median | 20.0% | 4.4% |
| Interquartile 25% (IQ1) | 14.7% | 2.8% |
| Interquartile 75% (IQ3) | 25.0% | 6.3% |
| Interquartile Range (IQR) | 10.3% | 3.5% |
| Standard Deviation (Sample) | 6.8% | 3.1% |
| Standard Deviation (Population) | 6.8% | 3.1% |
Similar Demographics by Receiving Food Stamps
Demographics Similar to Blacks/African Americans by Receiving Food Stamps
In terms of receiving food stamps, the demographic groups most similar to Blacks/African Americans are Menominee (17.2%, a difference of 0.17%), Immigrants from St. Vincent and the Grenadines (17.2%, a difference of 0.35%), Immigrants from Nicaragua (17.2%, a difference of 0.43%), Central American Indian (17.1%, a difference of 0.53%), and Native/Alaskan (17.3%, a difference of 0.62%).
| Demographics | Rating | Rank | Receiving Food Stamps |
| Immigrants | Barbados | 0.0 /100 | #310 | Tragic 16.6% |
| Guyanese | 0.0 /100 | #311 | Tragic 16.7% |
| Sioux | 0.0 /100 | #312 | Tragic 16.8% |
| Immigrants | Jamaica | 0.0 /100 | #313 | Tragic 16.9% |
| Immigrants | Guyana | 0.0 /100 | #314 | Tragic 16.9% |
| Bahamians | 0.0 /100 | #315 | Tragic 17.0% |
| Central American Indians | 0.0 /100 | #316 | Tragic 17.1% |
| Blacks/African Americans | 0.0 /100 | #317 | Tragic 17.2% |
| Menominee | 0.0 /100 | #318 | Tragic 17.2% |
| Immigrants | St. Vincent and the Grenadines | 0.0 /100 | #319 | Tragic 17.2% |
| Immigrants | Nicaragua | 0.0 /100 | #320 | Tragic 17.2% |
| Natives/Alaskans | 0.0 /100 | #321 | Tragic 17.3% |
| Immigrants | Grenada | 0.0 /100 | #322 | Tragic 17.8% |
| Haitians | 0.0 /100 | #323 | Tragic 17.8% |
| British West Indians | 0.0 /100 | #324 | Tragic 17.9% |
Demographics Similar to Thais by Receiving Food Stamps
In terms of receiving food stamps, the demographic groups most similar to Thais are Iranian (7.9%, a difference of 2.3%), Immigrants from Singapore (8.3%, a difference of 2.3%), Immigrants from Iran (8.3%, a difference of 2.9%), Burmese (8.6%, a difference of 6.6%), and Immigrants from Korea (8.7%, a difference of 6.8%).
| Demographics | Rating | Rank | Receiving Food Stamps |
| Immigrants | Taiwan | 100.0 /100 | #1 | Exceptional 7.3% |
| Immigrants | India | 100.0 /100 | #2 | Exceptional 7.4% |
| Filipinos | 100.0 /100 | #3 | Exceptional 7.4% |
| Iranians | 100.0 /100 | #4 | Exceptional 7.9% |
| Thais | 100.0 /100 | #5 | Exceptional 8.1% |
| Immigrants | Singapore | 100.0 /100 | #6 | Exceptional 8.3% |
| Immigrants | Iran | 100.0 /100 | #7 | Exceptional 8.3% |
| Burmese | 99.9 /100 | #8 | Exceptional 8.6% |
| Immigrants | Korea | 99.9 /100 | #9 | Exceptional 8.7% |
| Immigrants | South Central Asia | 99.9 /100 | #10 | Exceptional 8.8% |
| Okinawans | 99.9 /100 | #11 | Exceptional 8.9% |
| Cypriots | 99.9 /100 | #12 | Exceptional 8.9% |
| Bulgarians | 99.9 /100 | #13 | Exceptional 8.9% |
| Maltese | 99.9 /100 | #14 | Exceptional 8.9% |
| Norwegians | 99.9 /100 | #15 | Exceptional 9.0% |