Immigrants from Uzbekistan vs Kenyan Receiving Food Stamps
COMPARE
Immigrants from Uzbekistan
Kenyan
Receiving Food Stamps
Receiving Food Stamps Comparison
Immigrants from Uzbekistan
Kenyans
14.3%
RECEIVING FOOD STAMPS
0.2/ 100
METRIC RATING
264th/ 347
METRIC RANK
11.6%
RECEIVING FOOD STAMPS
60.2/ 100
METRIC RATING
167th/ 347
METRIC RANK
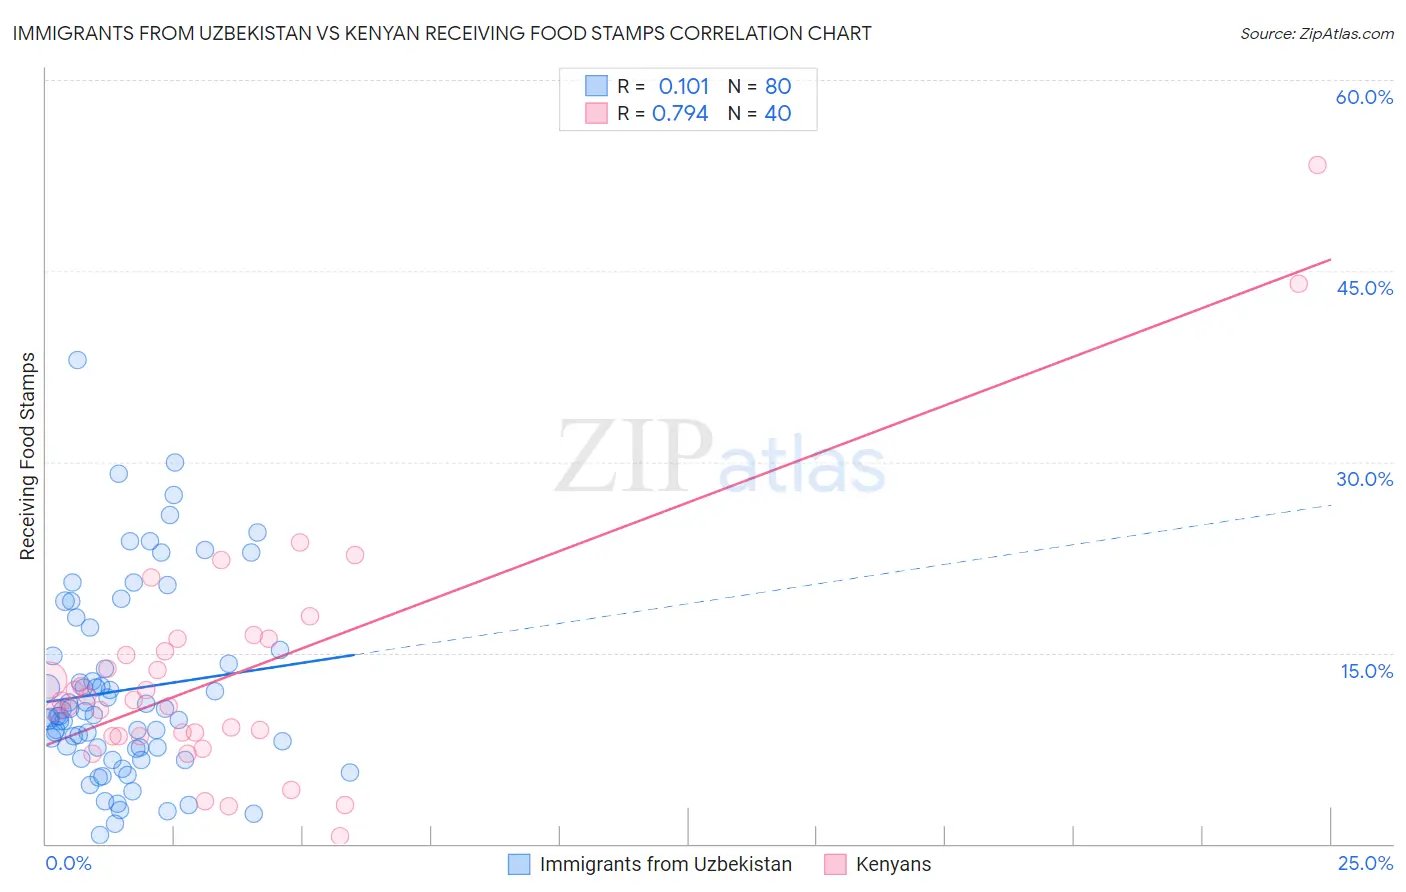
Immigrants from Uzbekistan vs Kenyan Receiving Food Stamps Correlation Chart
The statistical analysis conducted on geographies consisting of 118,563,262 people shows a poor positive correlation between the proportion of Immigrants from Uzbekistan and percentage of population receiving government assistance and/or food stamps in the United States with a correlation coefficient (R) of 0.101 and weighted average of 14.3%. Similarly, the statistical analysis conducted on geographies consisting of 168,088,158 people shows a strong positive correlation between the proportion of Kenyans and percentage of population receiving government assistance and/or food stamps in the United States with a correlation coefficient (R) of 0.794 and weighted average of 11.6%, a difference of 23.4%.
Receiving Food Stamps Correlation Summary
| Measurement | Immigrants from Uzbekistan | Kenyan |
| Minimum | 0.70% | 0.60% |
| Maximum | 38.0% | 53.3% |
| Range | 37.3% | 52.7% |
| Mean | 12.1% | 13.3% |
| Median | 10.1% | 11.2% |
| Interquartile 25% (IQ1) | 7.5% | 8.5% |
| Interquartile 75% (IQ3) | 15.0% | 15.6% |
| Interquartile Range (IQR) | 7.4% | 7.2% |
| Standard Deviation (Sample) | 7.5% | 9.9% |
| Standard Deviation (Population) | 7.4% | 9.7% |
Similar Demographics by Receiving Food Stamps
Demographics Similar to Immigrants from Uzbekistan by Receiving Food Stamps
In terms of receiving food stamps, the demographic groups most similar to Immigrants from Uzbekistan are Blackfeet (14.3%, a difference of 0.050%), Immigrants from Portugal (14.3%, a difference of 0.090%), Paiute (14.3%, a difference of 0.10%), Cheyenne (14.3%, a difference of 0.14%), and Dutch West Indian (14.3%, a difference of 0.36%).
| Demographics | Rating | Rank | Receiving Food Stamps |
| Arapaho | 0.3 /100 | #257 | Tragic 14.1% |
| Immigrants | Ghana | 0.3 /100 | #258 | Tragic 14.1% |
| Creek | 0.3 /100 | #259 | Tragic 14.1% |
| Central Americans | 0.3 /100 | #260 | Tragic 14.1% |
| Immigrants | Congo | 0.3 /100 | #261 | Tragic 14.1% |
| Paiute | 0.2 /100 | #262 | Tragic 14.3% |
| Immigrants | Portugal | 0.2 /100 | #263 | Tragic 14.3% |
| Immigrants | Uzbekistan | 0.2 /100 | #264 | Tragic 14.3% |
| Blackfeet | 0.2 /100 | #265 | Tragic 14.3% |
| Cheyenne | 0.2 /100 | #266 | Tragic 14.3% |
| Dutch West Indians | 0.2 /100 | #267 | Tragic 14.3% |
| Guatemalans | 0.1 /100 | #268 | Tragic 14.4% |
| Nepalese | 0.1 /100 | #269 | Tragic 14.6% |
| Mexicans | 0.1 /100 | #270 | Tragic 14.6% |
| Immigrants | Guatemala | 0.1 /100 | #271 | Tragic 14.6% |
Demographics Similar to Kenyans by Receiving Food Stamps
In terms of receiving food stamps, the demographic groups most similar to Kenyans are Tlingit-Haida (11.6%, a difference of 0.16%), Immigrants from Eastern Africa (11.6%, a difference of 0.28%), Costa Rican (11.6%, a difference of 0.35%), Immigrants from Belarus (11.5%, a difference of 0.38%), and Immigrants from Western Asia (11.6%, a difference of 0.56%).
| Demographics | Rating | Rank | Receiving Food Stamps |
| French Canadians | 69.5 /100 | #160 | Good 11.4% |
| Pennsylvania Germans | 68.4 /100 | #161 | Good 11.4% |
| Alsatians | 68.0 /100 | #162 | Good 11.4% |
| Immigrants | Southern Europe | 65.8 /100 | #163 | Good 11.5% |
| Immigrants | Chile | 65.0 /100 | #164 | Good 11.5% |
| Arabs | 64.7 /100 | #165 | Good 11.5% |
| Immigrants | Belarus | 62.8 /100 | #166 | Good 11.5% |
| Kenyans | 60.2 /100 | #167 | Good 11.6% |
| Tlingit-Haida | 59.1 /100 | #168 | Average 11.6% |
| Immigrants | Eastern Africa | 58.3 /100 | #169 | Average 11.6% |
| Costa Ricans | 57.9 /100 | #170 | Average 11.6% |
| Immigrants | Western Asia | 56.4 /100 | #171 | Average 11.6% |
| Guamanians/Chamorros | 54.2 /100 | #172 | Average 11.7% |
| Immigrants | Syria | 53.4 /100 | #173 | Average 11.7% |
| Immigrants | Eritrea | 50.0 /100 | #174 | Average 11.7% |