Immigrants from Trinidad and Tobago vs Brazilian Female Poverty
COMPARE
Immigrants from Trinidad and Tobago
Brazilian
Female Poverty
Female Poverty Comparison
Immigrants from Trinidad and Tobago
Brazilians
15.4%
FEMALE POVERTY
0.3/ 100
METRIC RATING
251st/ 347
METRIC RANK
13.0%
FEMALE POVERTY
80.5/ 100
METRIC RATING
142nd/ 347
METRIC RANK
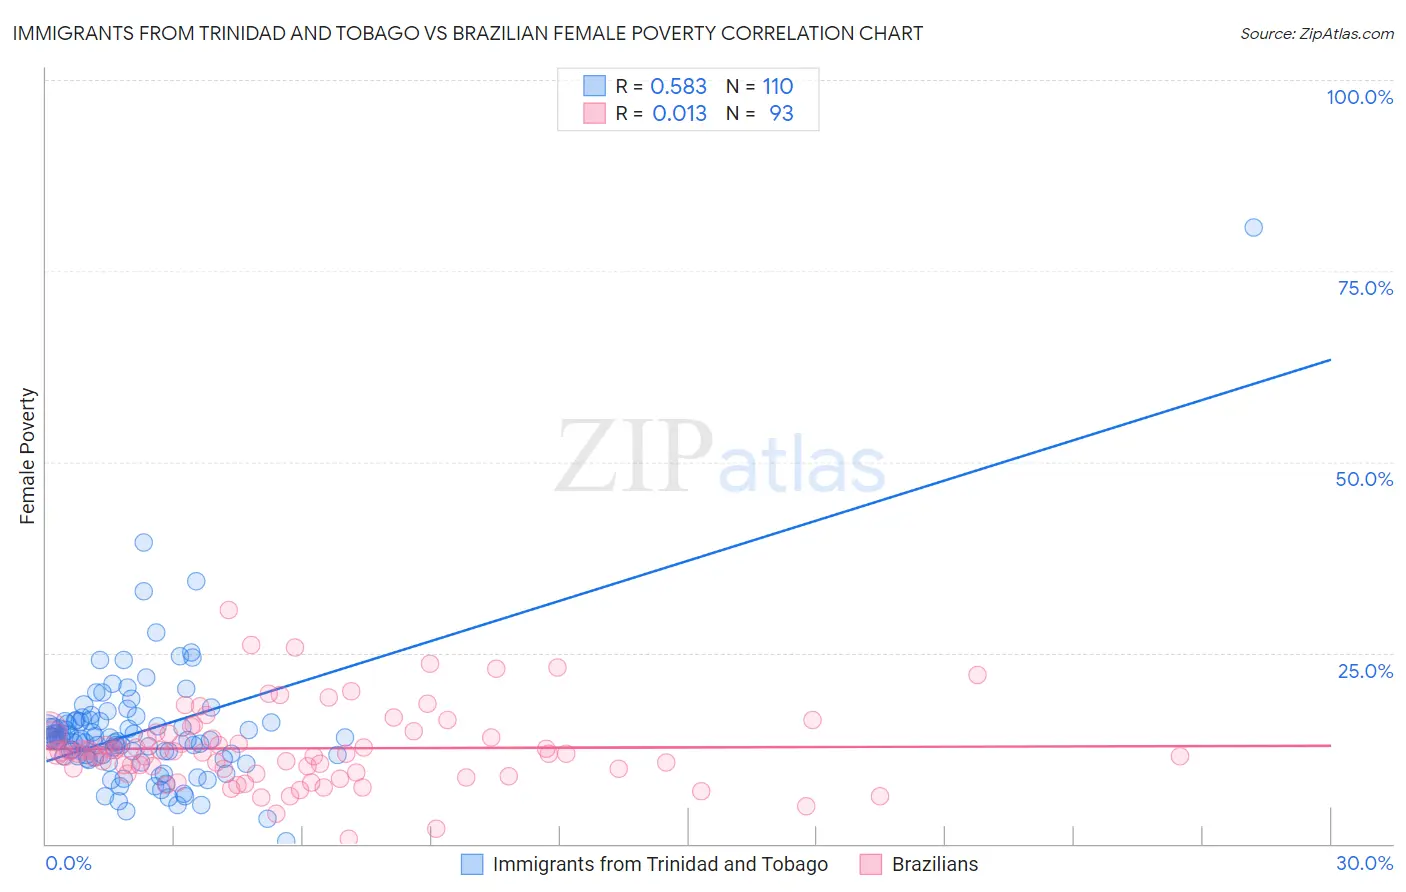
Immigrants from Trinidad and Tobago vs Brazilian Female Poverty Correlation Chart
The statistical analysis conducted on geographies consisting of 223,462,695 people shows a substantial positive correlation between the proportion of Immigrants from Trinidad and Tobago and poverty level among females in the United States with a correlation coefficient (R) of 0.583 and weighted average of 15.4%. Similarly, the statistical analysis conducted on geographies consisting of 323,667,111 people shows no correlation between the proportion of Brazilians and poverty level among females in the United States with a correlation coefficient (R) of 0.013 and weighted average of 13.0%, a difference of 18.3%.
Female Poverty Correlation Summary
| Measurement | Immigrants from Trinidad and Tobago | Brazilian |
| Minimum | 0.35% | 0.74% |
| Maximum | 80.6% | 30.6% |
| Range | 80.3% | 29.9% |
| Mean | 14.7% | 12.5% |
| Median | 13.7% | 11.9% |
| Interquartile 25% (IQ1) | 11.4% | 9.6% |
| Interquartile 75% (IQ3) | 16.1% | 14.4% |
| Interquartile Range (IQR) | 4.7% | 4.9% |
| Standard Deviation (Sample) | 8.7% | 5.1% |
| Standard Deviation (Population) | 8.7% | 5.1% |
Similar Demographics by Female Poverty
Demographics Similar to Immigrants from Trinidad and Tobago by Female Poverty
In terms of female poverty, the demographic groups most similar to Immigrants from Trinidad and Tobago are Immigrants from Burma/Myanmar (15.4%, a difference of 0.030%), Immigrants from Western Africa (15.3%, a difference of 0.16%), Salvadoran (15.3%, a difference of 0.20%), Liberian (15.4%, a difference of 0.30%), and Immigrants from Ghana (15.3%, a difference of 0.34%).
| Demographics | Rating | Rank | Female Poverty |
| Ecuadorians | 0.3 /100 | #244 | Tragic 15.3% |
| Spanish American Indians | 0.3 /100 | #245 | Tragic 15.3% |
| Cubans | 0.3 /100 | #246 | Tragic 15.3% |
| Potawatomi | 0.3 /100 | #247 | Tragic 15.3% |
| Immigrants | Ghana | 0.3 /100 | #248 | Tragic 15.3% |
| Salvadorans | 0.3 /100 | #249 | Tragic 15.3% |
| Immigrants | Western Africa | 0.3 /100 | #250 | Tragic 15.3% |
| Immigrants | Trinidad and Tobago | 0.3 /100 | #251 | Tragic 15.4% |
| Immigrants | Burma/Myanmar | 0.3 /100 | #252 | Tragic 15.4% |
| Liberians | 0.2 /100 | #253 | Tragic 15.4% |
| Trinidadians and Tobagonians | 0.2 /100 | #254 | Tragic 15.4% |
| Ottawa | 0.2 /100 | #255 | Tragic 15.5% |
| Jamaicans | 0.2 /100 | #256 | Tragic 15.5% |
| Immigrants | Jamaica | 0.1 /100 | #257 | Tragic 15.6% |
| Shoshone | 0.1 /100 | #258 | Tragic 15.6% |
Demographics Similar to Brazilians by Female Poverty
In terms of female poverty, the demographic groups most similar to Brazilians are Immigrants from Malaysia (13.0%, a difference of 0.020%), Icelander (13.0%, a difference of 0.10%), Afghan (13.0%, a difference of 0.11%), Syrian (13.0%, a difference of 0.14%), and Immigrants from Peru (13.0%, a difference of 0.22%).
| Demographics | Rating | Rank | Female Poverty |
| French | 85.6 /100 | #135 | Excellent 12.9% |
| Peruvians | 85.2 /100 | #136 | Excellent 12.9% |
| Chileans | 84.7 /100 | #137 | Excellent 12.9% |
| Immigrants | France | 83.6 /100 | #138 | Excellent 12.9% |
| Basques | 83.1 /100 | #139 | Excellent 12.9% |
| Pakistanis | 83.0 /100 | #140 | Excellent 12.9% |
| Icelanders | 81.1 /100 | #141 | Excellent 13.0% |
| Brazilians | 80.5 /100 | #142 | Excellent 13.0% |
| Immigrants | Malaysia | 80.4 /100 | #143 | Excellent 13.0% |
| Afghans | 79.8 /100 | #144 | Good 13.0% |
| Syrians | 79.6 /100 | #145 | Good 13.0% |
| Immigrants | Peru | 79.1 /100 | #146 | Good 13.0% |
| Immigrants | Kazakhstan | 78.6 /100 | #147 | Good 13.0% |
| Yugoslavians | 76.9 /100 | #148 | Good 13.1% |
| Taiwanese | 75.7 /100 | #149 | Good 13.1% |