Immigrants from Croatia vs Brazilian Female Poverty

COMPARE

Immigrants from Croatia
Race
Ancestry
AfghanAfricanAlaska NativeAlaskan AthabascanAlbanianAleutAlsatianAmericanApacheArabArapahoArgentineanArmenianAssyrian/Chaldean/SyriacAustralianAustrianBahamianBangladeshiBarbadianBasqueBelgianBelizeanBermudanBhutaneseBlackfeetBolivianBritishBritish West IndianBulgarianBurmeseCajunCambodianCanadianCape VerdeanCarpatho RusynCelticCentral AmericanCentral American IndianCherokeeCheyenneChickasawChileanChineseChippewaChoctawColombianColvilleComancheCosta RicanCreeCreekCroatianCrowCubanCypriotCzechCzechoslovakianDanishDelawareDominicanDutchDutch West IndianEastern EuropeanEcuadorianEgyptianEnglishEstonianEthiopianEuropeanFijianFilipinoFinnishFrenchFrench American IndianFrench CanadianGermanGerman RussianGhanaianGreekGuamanian/ChamorroGuatemalanGuyaneseHaitianHmongHonduranHopiHoumaHungarianIcelanderIndian (Asian)IndonesianInupiatIranianIraqiIrishIroquoisIsraeliItalianJamaicanJapaneseJordanianKenyanKiowaKoreanLaotianLatvianLebaneseLiberianLithuanianLumbeeLuxembourgerMacedonianMalaysianMalteseMarshalleseMenomineeMexicanMexican American IndianMongolianMoroccanNative HawaiianNavajoNepaleseNew ZealanderNicaraguanNigerianNorthern EuropeanNorwegianOkinawanOsageOttawaPaiutePakistaniPalestinianPanamanianParaguayanPennsylvania GermanPeruvianPimaPolishPortuguesePotawatomiPuebloPuerto RicanPuget Sound SalishRomanianRussianSalvadoranSamoanScandinavianScotch-IrishScottishSeminoleSenegaleseSerbianShoshoneSierra LeoneanSiouxSlavicSlovakSloveneSomaliSouth AfricanSouth AmericanSouth American IndianSoviet UnionSpaniardSpanishSpanish AmericanSpanish American IndianSri LankanSubsaharan AfricanSudaneseSwedishSwissSyrianTaiwaneseThaiTlingit-HaidaTohono O'OdhamTonganTrinidadian and TobagonianTsimshianTurkishU.S. Virgin IslanderUgandanUkrainianUruguayanUteVenezuelanVietnameseWelshWest IndianYakamaYaquiYugoslavianYumanYup'ikZimbabwean
Immigration
NonimmigrantsImmigrantsAfghanistanAfricaAlbaniaArgentinaArmeniaAsiaAustraliaAustriaBahamasBangladeshBarbadosBelarusBelgiumBelizeBoliviaBosnia and HerzegovinaBrazilBulgariaBurma/MyanmarCabo VerdeCambodiaCameroonCanadaCaribbeanCentral AmericaChileChinaColombiaCongoCosta RicaCroatiaCubaCzechoslovakiaDenmarkDominicaDominican RepublicEastern AfricaEastern AsiaEastern EuropeEcuadorEgyptEl SalvadorEnglandEritreaEthiopiaEuropeFijiFranceGermanyGhanaGreeceGrenadaGuatemalaGuyanaHaitiHondurasHong KongHungaryIndiaIndonesiaIranIraqIrelandIsraelItalyJamaicaJapanJordanKazakhstanKenyaKoreaKuwaitLaosLatin AmericaLatviaLebanonLiberiaLithuaniaMalaysiaMexicoMicronesiaMiddle AfricaMoldovaMoroccoNepalNetherlandsNicaraguaNigeriaNorth AmericaNorth MacedoniaNorthern AfricaNorthern EuropeNorwayOceaniaPakistanPanamaPeruPhilippinesPolandPortugalRomaniaRussiaSaudi ArabiaScotlandSenegalSerbiaSierra LeoneSingaporeSomaliaSouth AfricaSouth AmericaSouth Central AsiaSouth Eastern AsiaSouthern EuropeSpainSri LankaSt. Vincent and the GrenadinesSudanSwedenSwitzerlandSyriaTaiwanThailandTrinidad and TobagoTurkeyUgandaUkraineUruguayUzbekistanVenezuelaVietnamWest IndiesWestern AfricaWestern AsiaWestern EuropeYemenZaireZimbabweAzores
Brazilian
Race
Ancestry
AfghanAfricanAlaska NativeAlaskan AthabascanAlbanianAleutAlsatianAmericanApacheArabArapahoArgentineanArmenianAssyrian/Chaldean/SyriacAustralianAustrianBahamianBangladeshiBarbadianBasqueBelgianBelizeanBermudanBhutaneseBlackfeetBolivianBrazilianBritishBritish West IndianBulgarianBurmeseCajunCambodianCanadianCape VerdeanCarpatho RusynCelticCentral AmericanCentral American IndianCherokeeCheyenneChickasawChileanChineseChippewaChoctawColombianColvilleComancheCosta RicanCreeCreekCroatianCrowCubanCypriotCzechCzechoslovakianDanishDelawareDominicanDutchDutch West IndianEastern EuropeanEcuadorianEgyptianEnglishEstonianEthiopianEuropeanFijianFilipinoFinnishFrenchFrench American IndianFrench CanadianGermanGerman RussianGhanaianGreekGuamanian/ChamorroGuatemalanGuyaneseHaitianHmongHonduranHopiHoumaHungarianIcelanderIndian (Asian)IndonesianInupiatIranianIraqiIrishIroquoisIsraeliItalianJamaicanJapaneseJordanianKenyanKiowaKoreanLaotianLatvianLebaneseLiberianLithuanianLumbeeLuxembourgerMacedonianMalaysianMalteseMarshalleseMenomineeMexicanMexican American IndianMongolianMoroccanNative HawaiianNavajoNepaleseNew ZealanderNicaraguanNigerianNorthern EuropeanNorwegianOkinawanOsageOttawaPaiutePakistaniPalestinianPanamanianParaguayanPennsylvania GermanPeruvianPimaPolishPortuguesePotawatomiPuebloPuerto RicanPuget Sound SalishRomanianRussianSalvadoranSamoanScandinavianScotch-IrishScottishSeminoleSenegaleseSerbianShoshoneSierra LeoneanSiouxSlavicSlovakSloveneSomaliSouth AfricanSouth AmericanSouth American IndianSoviet UnionSpaniardSpanishSpanish AmericanSpanish American IndianSri LankanSubsaharan AfricanSudaneseSwedishSwissSyrianTaiwaneseThaiTlingit-HaidaTohono O'OdhamTonganTrinidadian and TobagonianTsimshianTurkishU.S. Virgin IslanderUgandanUkrainianUruguayanUteVenezuelanVietnameseWelshWest IndianYakamaYaquiYugoslavianYumanYup'ikZimbabwean
Immigration
NonimmigrantsImmigrantsAfghanistanAfricaAlbaniaArgentinaArmeniaAsiaAustraliaAustriaBahamasBangladeshBarbadosBelarusBelgiumBelizeBoliviaBosnia and HerzegovinaBrazilBulgariaBurma/MyanmarCabo VerdeCambodiaCameroonCanadaCaribbeanCentral AmericaChileChinaColombiaCongoCosta RicaCubaCzechoslovakiaDenmarkDominicaDominican RepublicEastern AfricaEastern AsiaEastern EuropeEcuadorEgyptEl SalvadorEnglandEritreaEthiopiaEuropeFijiFranceGermanyGhanaGreeceGrenadaGuatemalaGuyanaHaitiHondurasHong KongHungaryIndiaIndonesiaIranIraqIrelandIsraelItalyJamaicaJapanJordanKazakhstanKenyaKoreaKuwaitLaosLatin AmericaLatviaLebanonLiberiaLithuaniaMalaysiaMexicoMicronesiaMiddle AfricaMoldovaMoroccoNepalNetherlandsNicaraguaNigeriaNorth AmericaNorth MacedoniaNorthern AfricaNorthern EuropeNorwayOceaniaPakistanPanamaPeruPhilippinesPolandPortugalRomaniaRussiaSaudi ArabiaScotlandSenegalSerbiaSierra LeoneSingaporeSomaliaSouth AfricaSouth AmericaSouth Central AsiaSouth Eastern AsiaSouthern EuropeSpainSri LankaSt. Vincent and the GrenadinesSudanSwedenSwitzerlandSyriaTaiwanThailandTrinidad and TobagoTurkeyUgandaUkraineUruguayUzbekistanVenezuelaVietnamWest IndiesWestern AfricaWestern AsiaWestern EuropeYemenZaireZimbabweAzores
Female Poverty
Income
Poverty
Unemployment
Labor Participation
Family Structure
Vehicle Availability
Education Level
Disability

Female Poverty Comparison

Immigrants from Croatia

Brazilians

Exceptional
Excellent
12.0%
FEMALE POVERTY
98.7/ 100
METRIC RATING
52nd/ 347
METRIC RANK
13.0%
FEMALE POVERTY
80.5/ 100
METRIC RATING
142nd/ 347
METRIC RANK

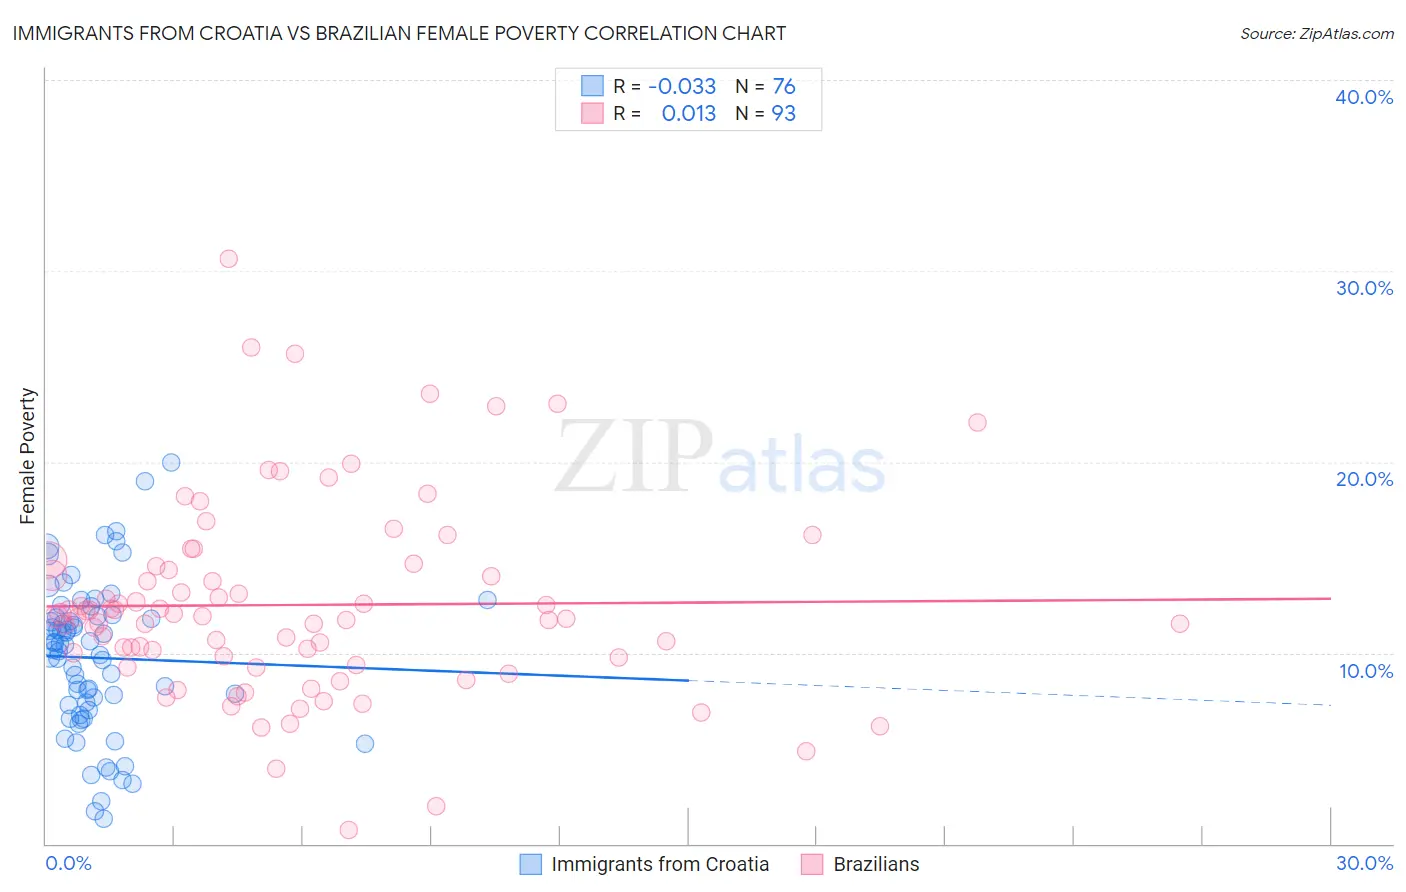
Immigrants from Croatia vs Brazilian Female Poverty Correlation Chart

The statistical analysis conducted on geographies consisting of 132,555,435 people shows no correlation between the proportion of Immigrants from Croatia and poverty level among females in the United States with a correlation coefficient (R) of -0.033 and weighted average of 12.0%. Similarly, the statistical analysis conducted on geographies consisting of 323,667,111 people shows no correlation between the proportion of Brazilians and poverty level among females in the United States with a correlation coefficient (R) of 0.013 and weighted average of 13.0%, a difference of 7.9%.
Immigrants from Croatia vs Brazilian Female Poverty

Female Poverty Correlation Summary

MeasurementImmigrants from CroatiaBrazilian
Minimum1.3%0.74%
Maximum20.0%30.6%
Range18.7%29.9%
Mean9.7%12.5%
Median10.3%11.9%
Interquartile 25% (IQ1)7.1%9.6%
Interquartile 75% (IQ3)11.9%14.4%
Interquartile Range (IQR)4.8%4.9%
Standard Deviation (Sample)3.9%5.1%
Standard Deviation (Population)3.9%5.1%

Similar Demographics by Female Poverty

Demographics Similar to Immigrants from Croatia by Female Poverty

In terms of female poverty, the demographic groups most similar to Immigrants from Croatia are Immigrants from Austria (12.0%, a difference of 0.010%), Immigrants from Philippines (12.1%, a difference of 0.15%), Immigrants from Bulgaria (12.0%, a difference of 0.31%), Immigrants from Sri Lanka (12.1%, a difference of 0.50%), and Slovene (12.0%, a difference of 0.52%).
DemographicsRating | RankFemale Poverty
Immigrants | Czechoslovakia
99.2
/100
|
#45
Exceptional
11.9%
Turks
99.2
/100
|
#46
Exceptional
11.9%
Asians
99.1
/100
|
#47
Exceptional
11.9%
Immigrants | Japan
99.0
/100
|
#48
Exceptional
11.9%
Immigrants | Romania
99.0
/100
|
#49
Exceptional
12.0%
Slovenes
98.9
/100
|
#50
Exceptional
12.0%
Immigrants | Bulgaria
98.9
/100
|
#51
Exceptional
12.0%
Immigrants | Croatia
98.7
/100
|
#52
Exceptional
12.0%
Immigrants | Austria
98.7
/100
|
#53
Exceptional
12.0%
Immigrants | Philippines
98.7
/100
|
#54
Exceptional
12.1%
Immigrants | Sri Lanka
98.5
/100
|
#55
Exceptional
12.1%
Estonians
98.3
/100
|
#56
Exceptional
12.1%
Immigrants | Serbia
98.3
/100
|
#57
Exceptional
12.1%
Scandinavians
98.2
/100
|
#58
Exceptional
12.1%
Immigrants | Europe
98.2
/100
|
#59
Exceptional
12.1%

Demographics Similar to Brazilians by Female Poverty

In terms of female poverty, the demographic groups most similar to Brazilians are Immigrants from Malaysia (13.0%, a difference of 0.020%), Icelander (13.0%, a difference of 0.10%), Afghan (13.0%, a difference of 0.11%), Syrian (13.0%, a difference of 0.14%), and Immigrants from Peru (13.0%, a difference of 0.22%).
DemographicsRating | RankFemale Poverty
French
85.6
/100
|
#135
Excellent
12.9%
Peruvians
85.2
/100
|
#136
Excellent
12.9%
Chileans
84.7
/100
|
#137
Excellent
12.9%
Immigrants | France
83.6
/100
|
#138
Excellent
12.9%
Basques
83.1
/100
|
#139
Excellent
12.9%
Pakistanis
83.0
/100
|
#140
Excellent
12.9%
Icelanders
81.1
/100
|
#141
Excellent
13.0%
Brazilians
80.5
/100
|
#142
Excellent
13.0%
Immigrants | Malaysia
80.4
/100
|
#143
Excellent
13.0%
Afghans
79.8
/100
|
#144
Good
13.0%
Syrians
79.6
/100
|
#145
Good
13.0%
Immigrants | Peru
79.1
/100
|
#146
Good
13.0%
Immigrants | Kazakhstan
78.6
/100
|
#147
Good
13.0%
Yugoslavians
76.9
/100
|
#148
Good
13.1%
Taiwanese
75.7
/100
|
#149
Good
13.1%