Immigrants from Southern Europe vs Immigrants from Uruguay Single Female Poverty
COMPARE
Immigrants from Southern Europe
Immigrants from Uruguay
Single Female Poverty
Single Female Poverty Comparison
Immigrants from Southern Europe
Immigrants from Uruguay
19.9%
SINGLE FEMALE POVERTY
97.1/ 100
METRIC RATING
103rd/ 347
METRIC RANK
20.6%
SINGLE FEMALE POVERTY
77.7/ 100
METRIC RATING
152nd/ 347
METRIC RANK
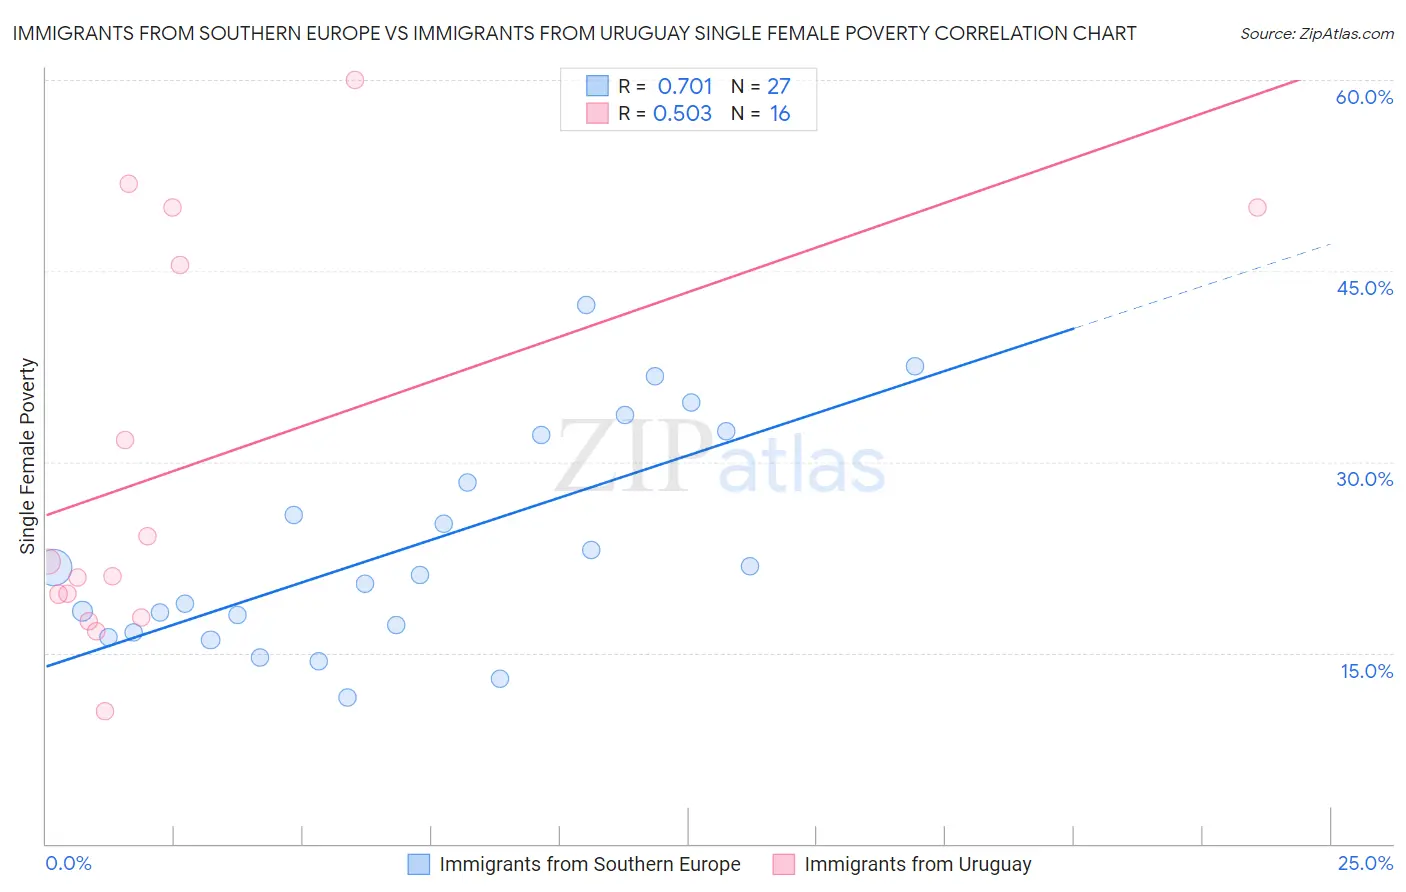
Immigrants from Southern Europe vs Immigrants from Uruguay Single Female Poverty Correlation Chart
The statistical analysis conducted on geographies consisting of 394,858,159 people shows a strong positive correlation between the proportion of Immigrants from Southern Europe and poverty level among single females in the United States with a correlation coefficient (R) of 0.701 and weighted average of 19.9%. Similarly, the statistical analysis conducted on geographies consisting of 132,556,340 people shows a substantial positive correlation between the proportion of Immigrants from Uruguay and poverty level among single females in the United States with a correlation coefficient (R) of 0.503 and weighted average of 20.6%, a difference of 3.7%.
Single Female Poverty Correlation Summary
| Measurement | Immigrants from Southern Europe | Immigrants from Uruguay |
| Minimum | 11.5% | 10.4% |
| Maximum | 42.3% | 60.0% |
| Range | 30.8% | 49.6% |
| Mean | 23.3% | 29.9% |
| Median | 21.1% | 21.6% |
| Interquartile 25% (IQ1) | 16.6% | 18.7% |
| Interquartile 75% (IQ3) | 32.1% | 47.7% |
| Interquartile Range (IQR) | 15.5% | 29.0% |
| Standard Deviation (Sample) | 8.5% | 15.8% |
| Standard Deviation (Population) | 8.3% | 15.3% |
Similar Demographics by Single Female Poverty
Demographics Similar to Immigrants from Southern Europe by Single Female Poverty
In terms of single female poverty, the demographic groups most similar to Immigrants from Southern Europe are Immigrants from Cameroon (19.8%, a difference of 0.12%), Chilean (19.9%, a difference of 0.12%), Immigrants from Belgium (19.8%, a difference of 0.13%), Israeli (19.9%, a difference of 0.13%), and Ethiopian (19.9%, a difference of 0.22%).
| Demographics | Rating | Rank | Single Female Poverty |
| Immigrants | Brazil | 98.2 /100 | #96 | Exceptional 19.7% |
| Croatians | 98.1 /100 | #97 | Exceptional 19.7% |
| Immigrants | France | 97.9 /100 | #98 | Exceptional 19.7% |
| Sierra Leoneans | 97.9 /100 | #99 | Exceptional 19.7% |
| Ukrainians | 97.6 /100 | #100 | Exceptional 19.8% |
| Immigrants | Belgium | 97.3 /100 | #101 | Exceptional 19.8% |
| Immigrants | Cameroon | 97.3 /100 | #102 | Exceptional 19.8% |
| Immigrants | Southern Europe | 97.1 /100 | #103 | Exceptional 19.9% |
| Chileans | 96.9 /100 | #104 | Exceptional 19.9% |
| Israelis | 96.9 /100 | #105 | Exceptional 19.9% |
| Ethiopians | 96.7 /100 | #106 | Exceptional 19.9% |
| Immigrants | Syria | 96.7 /100 | #107 | Exceptional 19.9% |
| Native Hawaiians | 96.6 /100 | #108 | Exceptional 19.9% |
| Colombians | 96.6 /100 | #109 | Exceptional 19.9% |
| Immigrants | Western Asia | 96.5 /100 | #110 | Exceptional 19.9% |
Demographics Similar to Immigrants from Uruguay by Single Female Poverty
In terms of single female poverty, the demographic groups most similar to Immigrants from Uruguay are Swedish (20.6%, a difference of 0.050%), Immigrants from Western Europe (20.6%, a difference of 0.080%), Samoan (20.6%, a difference of 0.15%), South American Indian (20.6%, a difference of 0.18%), and Puget Sound Salish (20.6%, a difference of 0.19%).
| Demographics | Rating | Rank | Single Female Poverty |
| Austrians | 85.8 /100 | #145 | Excellent 20.4% |
| Venezuelans | 85.5 /100 | #146 | Excellent 20.4% |
| South Africans | 85.3 /100 | #147 | Excellent 20.4% |
| Luxembourgers | 84.9 /100 | #148 | Excellent 20.4% |
| Portuguese | 81.5 /100 | #149 | Excellent 20.5% |
| Immigrants | Denmark | 80.5 /100 | #150 | Excellent 20.5% |
| Puget Sound Salish | 79.6 /100 | #151 | Good 20.6% |
| Immigrants | Uruguay | 77.7 /100 | #152 | Good 20.6% |
| Swedes | 77.1 /100 | #153 | Good 20.6% |
| Immigrants | Western Europe | 76.7 /100 | #154 | Good 20.6% |
| Samoans | 76.0 /100 | #155 | Good 20.6% |
| South American Indians | 75.7 /100 | #156 | Good 20.6% |
| Immigrants | Oceania | 74.3 /100 | #157 | Good 20.7% |
| Danes | 73.0 /100 | #158 | Good 20.7% |
| Costa Ricans | 71.8 /100 | #159 | Good 20.7% |