Immigrants from Southern Europe vs Houma Single Female Poverty
COMPARE
Immigrants from Southern Europe
Houma
Single Female Poverty
Single Female Poverty Comparison
Immigrants from Southern Europe
Houma
19.9%
SINGLE FEMALE POVERTY
97.1/ 100
METRIC RATING
103rd/ 347
METRIC RANK
33.8%
SINGLE FEMALE POVERTY
0.0/ 100
METRIC RATING
345th/ 347
METRIC RANK
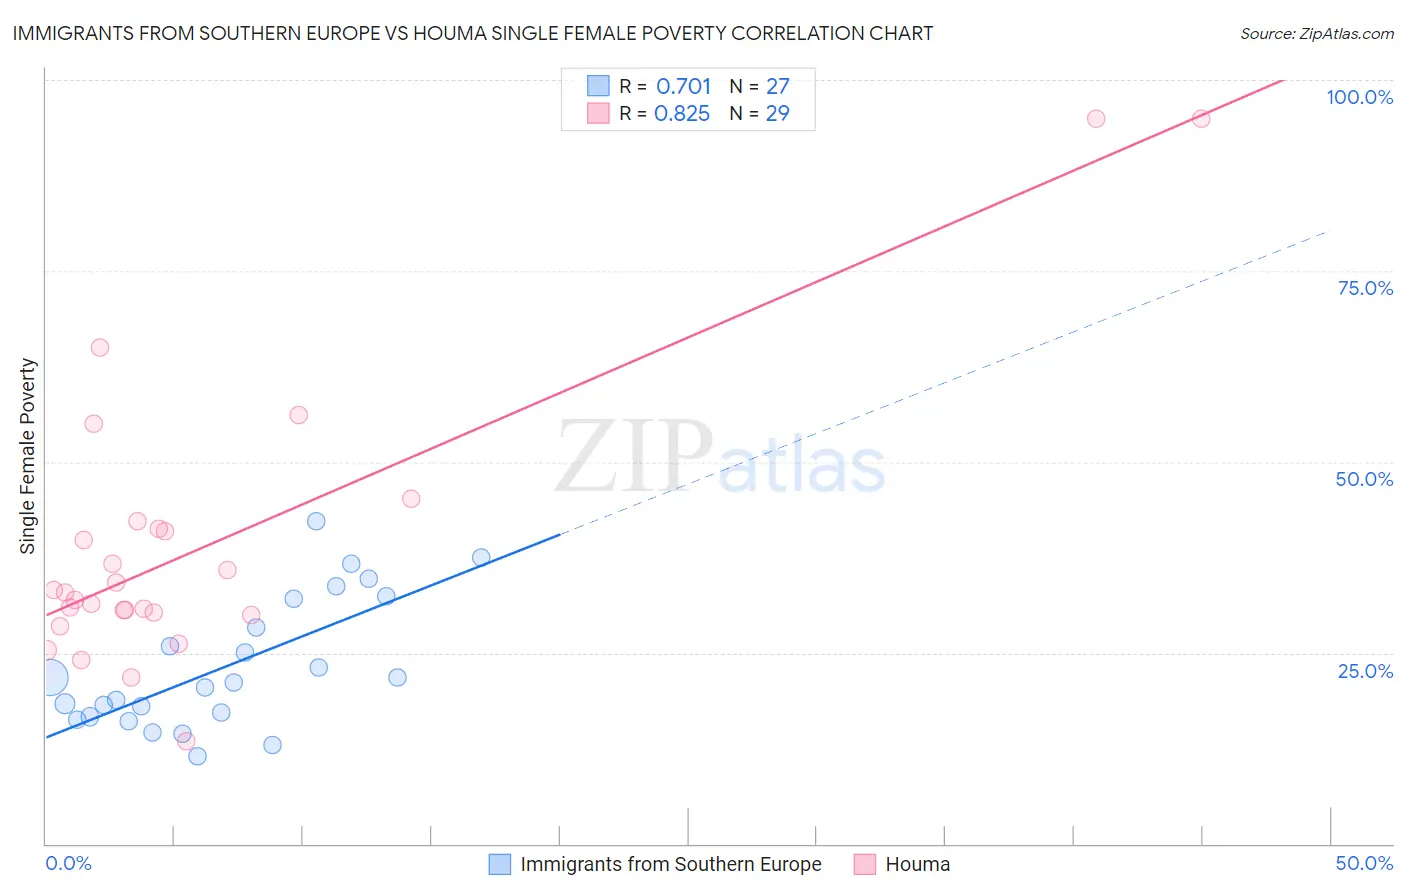
Immigrants from Southern Europe vs Houma Single Female Poverty Correlation Chart
The statistical analysis conducted on geographies consisting of 394,858,159 people shows a strong positive correlation between the proportion of Immigrants from Southern Europe and poverty level among single females in the United States with a correlation coefficient (R) of 0.701 and weighted average of 19.9%. Similarly, the statistical analysis conducted on geographies consisting of 36,729,698 people shows a very strong positive correlation between the proportion of Houma and poverty level among single females in the United States with a correlation coefficient (R) of 0.825 and weighted average of 33.8%, a difference of 70.2%.
Single Female Poverty Correlation Summary
| Measurement | Immigrants from Southern Europe | Houma |
| Minimum | 11.5% | 13.4% |
| Maximum | 42.3% | 94.8% |
| Range | 30.8% | 81.5% |
| Mean | 23.3% | 39.1% |
| Median | 21.1% | 33.0% |
| Interquartile 25% (IQ1) | 16.6% | 30.1% |
| Interquartile 75% (IQ3) | 32.1% | 41.8% |
| Interquartile Range (IQR) | 15.5% | 11.6% |
| Standard Deviation (Sample) | 8.5% | 18.7% |
| Standard Deviation (Population) | 8.3% | 18.4% |
Similar Demographics by Single Female Poverty
Demographics Similar to Immigrants from Southern Europe by Single Female Poverty
In terms of single female poverty, the demographic groups most similar to Immigrants from Southern Europe are Immigrants from Cameroon (19.8%, a difference of 0.12%), Chilean (19.9%, a difference of 0.12%), Immigrants from Belgium (19.8%, a difference of 0.13%), Israeli (19.9%, a difference of 0.13%), and Ethiopian (19.9%, a difference of 0.22%).
| Demographics | Rating | Rank | Single Female Poverty |
| Immigrants | Brazil | 98.2 /100 | #96 | Exceptional 19.7% |
| Croatians | 98.1 /100 | #97 | Exceptional 19.7% |
| Immigrants | France | 97.9 /100 | #98 | Exceptional 19.7% |
| Sierra Leoneans | 97.9 /100 | #99 | Exceptional 19.7% |
| Ukrainians | 97.6 /100 | #100 | Exceptional 19.8% |
| Immigrants | Belgium | 97.3 /100 | #101 | Exceptional 19.8% |
| Immigrants | Cameroon | 97.3 /100 | #102 | Exceptional 19.8% |
| Immigrants | Southern Europe | 97.1 /100 | #103 | Exceptional 19.9% |
| Chileans | 96.9 /100 | #104 | Exceptional 19.9% |
| Israelis | 96.9 /100 | #105 | Exceptional 19.9% |
| Ethiopians | 96.7 /100 | #106 | Exceptional 19.9% |
| Immigrants | Syria | 96.7 /100 | #107 | Exceptional 19.9% |
| Native Hawaiians | 96.6 /100 | #108 | Exceptional 19.9% |
| Colombians | 96.6 /100 | #109 | Exceptional 19.9% |
| Immigrants | Western Asia | 96.5 /100 | #110 | Exceptional 19.9% |
Demographics Similar to Houma by Single Female Poverty
In terms of single female poverty, the demographic groups most similar to Houma are Puerto Rican (34.1%, a difference of 0.92%), Tohono O'odham (34.2%, a difference of 1.2%), Lumbee (33.0%, a difference of 2.4%), Crow (32.4%, a difference of 4.3%), and Navajo (31.7%, a difference of 6.8%).
| Demographics | Rating | Rank | Single Female Poverty |
| Ute | 0.0 /100 | #333 | Tragic 28.4% |
| Pueblo | 0.0 /100 | #334 | Tragic 28.6% |
| Immigrants | Yemen | 0.0 /100 | #335 | Tragic 28.9% |
| Colville | 0.0 /100 | #336 | Tragic 29.1% |
| Yuman | 0.0 /100 | #337 | Tragic 29.4% |
| Pima | 0.0 /100 | #338 | Tragic 30.3% |
| Cheyenne | 0.0 /100 | #339 | Tragic 30.4% |
| Cajuns | 0.0 /100 | #340 | Tragic 30.6% |
| Sioux | 0.0 /100 | #341 | Tragic 31.3% |
| Navajo | 0.0 /100 | #342 | Tragic 31.7% |
| Crow | 0.0 /100 | #343 | Tragic 32.4% |
| Lumbee | 0.0 /100 | #344 | Tragic 33.0% |
| Houma | 0.0 /100 | #345 | Tragic 33.8% |
| Puerto Ricans | 0.0 /100 | #346 | Tragic 34.1% |
| Tohono O'odham | 0.0 /100 | #347 | Tragic 34.2% |