Immigrants from South Eastern Asia vs Immigrants from Northern Africa Family Poverty
COMPARE
Immigrants from South Eastern Asia
Immigrants from Northern Africa
Family Poverty
Family Poverty Comparison
Immigrants from South Eastern Asia
Immigrants from Northern Africa
8.5%
FAMILY POVERTY
83.2/ 100
METRIC RATING
145th/ 347
METRIC RANK
8.8%
FAMILY POVERTY
66.9/ 100
METRIC RATING
161st/ 347
METRIC RANK
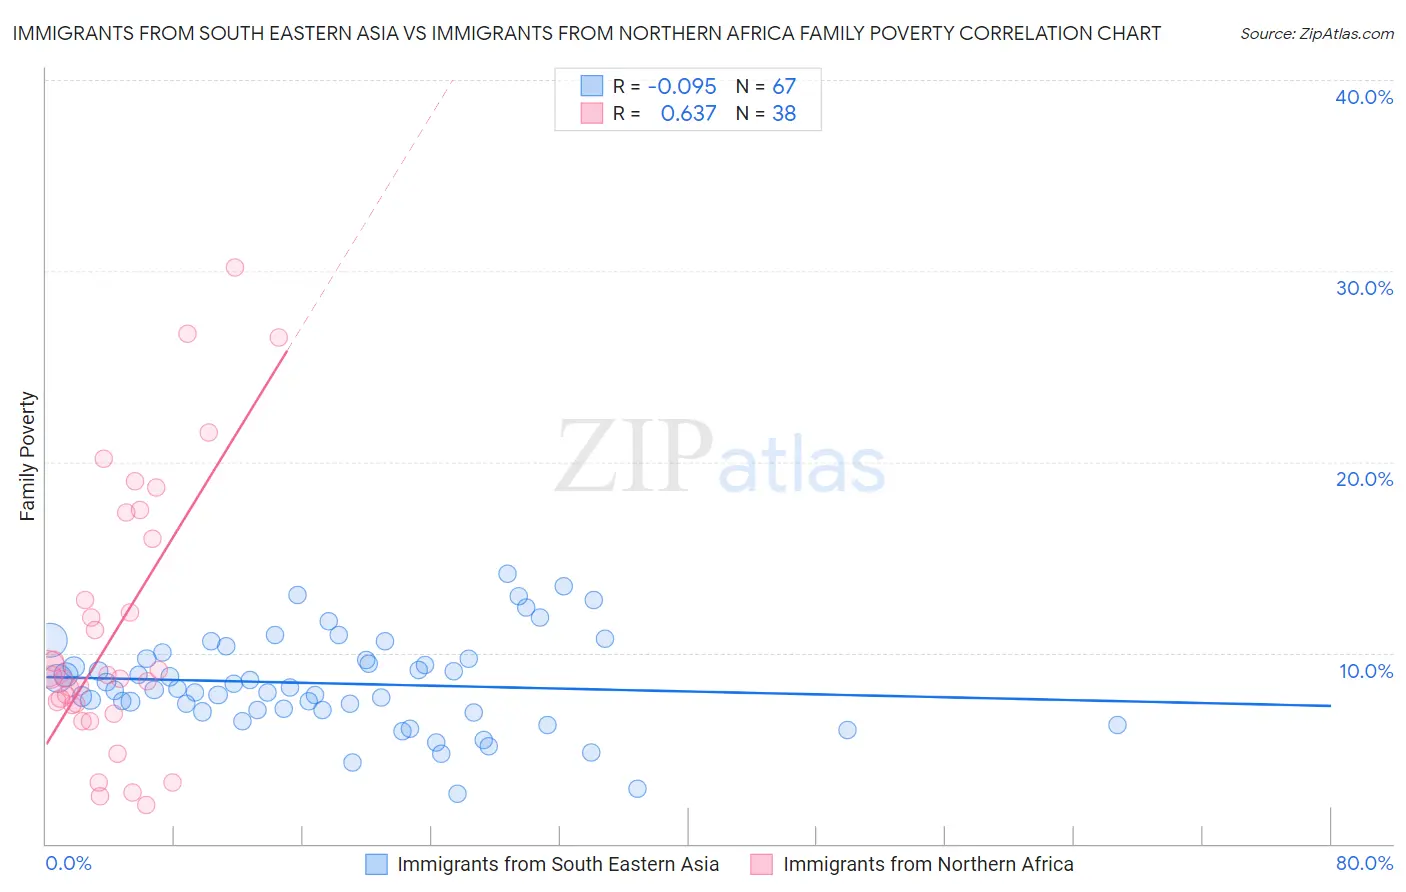
Immigrants from South Eastern Asia vs Immigrants from Northern Africa Family Poverty Correlation Chart
The statistical analysis conducted on geographies consisting of 510,315,048 people shows a slight negative correlation between the proportion of Immigrants from South Eastern Asia and poverty level among families in the United States with a correlation coefficient (R) of -0.095 and weighted average of 8.5%. Similarly, the statistical analysis conducted on geographies consisting of 320,660,985 people shows a significant positive correlation between the proportion of Immigrants from Northern Africa and poverty level among families in the United States with a correlation coefficient (R) of 0.637 and weighted average of 8.8%, a difference of 3.1%.
Family Poverty Correlation Summary
| Measurement | Immigrants from South Eastern Asia | Immigrants from Northern Africa |
| Minimum | 2.6% | 2.0% |
| Maximum | 14.1% | 30.2% |
| Range | 11.5% | 28.1% |
| Mean | 8.4% | 11.2% |
| Median | 8.1% | 8.7% |
| Interquartile 25% (IQ1) | 7.0% | 7.3% |
| Interquartile 75% (IQ3) | 9.7% | 16.0% |
| Interquartile Range (IQR) | 2.7% | 8.7% |
| Standard Deviation (Sample) | 2.4% | 7.1% |
| Standard Deviation (Population) | 2.4% | 7.0% |
Demographics Similar to Immigrants from South Eastern Asia and Immigrants from Northern Africa by Family Poverty
In terms of family poverty, the demographic groups most similar to Immigrants from South Eastern Asia are Immigrants from Belarus (8.5%, a difference of 0.010%), Albanian (8.5%, a difference of 0.020%), Immigrants from Germany (8.5%, a difference of 0.040%), Immigrants from Jordan (8.5%, a difference of 0.050%), and Scotch-Irish (8.6%, a difference of 0.25%). Similarly, the demographic groups most similar to Immigrants from Northern Africa are Hungarian (8.8%, a difference of 0.040%), Ethiopian (8.8%, a difference of 0.090%), Pennsylvania German (8.8%, a difference of 0.14%), Peruvian (8.8%, a difference of 0.17%), and White/Caucasian (8.8%, a difference of 0.33%).
| Demographics | Rating | Rank | Family Poverty |
| Immigrants | Germany | 83.3 /100 | #143 | Excellent 8.5% |
| Albanians | 83.3 /100 | #144 | Excellent 8.5% |
| Immigrants | South Eastern Asia | 83.2 /100 | #145 | Excellent 8.5% |
| Immigrants | Belarus | 83.2 /100 | #146 | Excellent 8.5% |
| Immigrants | Jordan | 83.0 /100 | #147 | Excellent 8.5% |
| Scotch-Irish | 82.2 /100 | #148 | Excellent 8.6% |
| Mongolians | 80.4 /100 | #149 | Excellent 8.6% |
| Syrians | 80.3 /100 | #150 | Excellent 8.6% |
| Brazilians | 80.1 /100 | #151 | Excellent 8.6% |
| Samoans | 79.8 /100 | #152 | Good 8.6% |
| Immigrants | Spain | 79.1 /100 | #153 | Good 8.6% |
| Immigrants | Vietnam | 75.4 /100 | #154 | Good 8.7% |
| Immigrants | Kuwait | 73.6 /100 | #155 | Good 8.7% |
| Immigrants | Oceania | 71.2 /100 | #156 | Good 8.7% |
| Tsimshian | 69.3 /100 | #157 | Good 8.8% |
| Whites/Caucasians | 69.1 /100 | #158 | Good 8.8% |
| Peruvians | 68.0 /100 | #159 | Good 8.8% |
| Hungarians | 67.2 /100 | #160 | Good 8.8% |
| Immigrants | Northern Africa | 66.9 /100 | #161 | Good 8.8% |
| Ethiopians | 66.3 /100 | #162 | Good 8.8% |
| Pennsylvania Germans | 66.0 /100 | #163 | Good 8.8% |