Immigrants from South Africa vs Immigrants from Nigeria Poverty
COMPARE
Immigrants from South Africa
Immigrants from Nigeria
Poverty
Poverty Comparison
Immigrants from South Africa
Immigrants from Nigeria
11.5%
POVERTY
94.7/ 100
METRIC RATING
96th/ 347
METRIC RANK
13.5%
POVERTY
1.7/ 100
METRIC RATING
228th/ 347
METRIC RANK
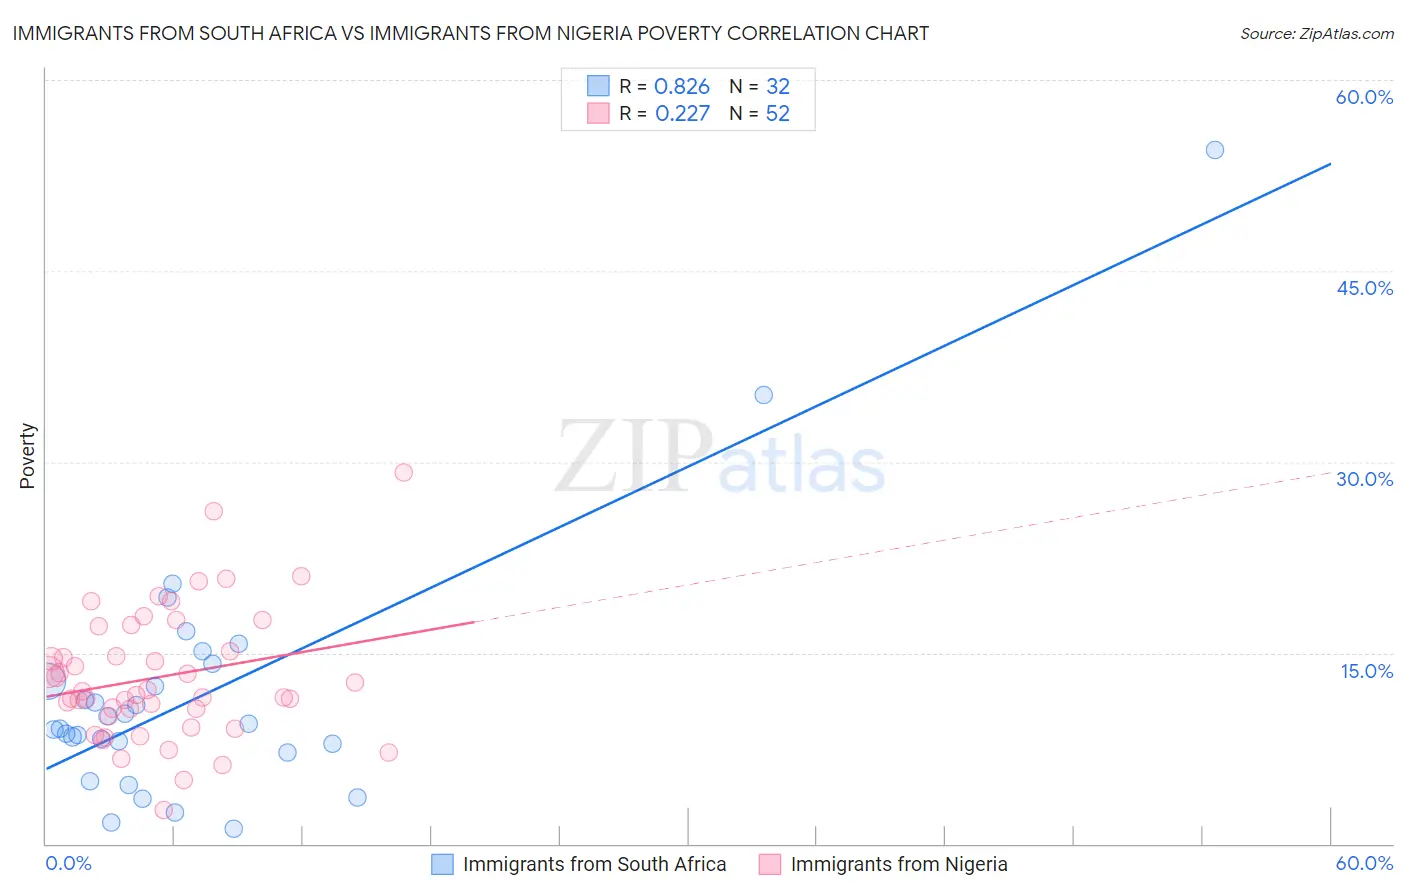
Immigrants from South Africa vs Immigrants from Nigeria Poverty Correlation Chart
The statistical analysis conducted on geographies consisting of 233,262,094 people shows a very strong positive correlation between the proportion of Immigrants from South Africa and poverty level in the United States with a correlation coefficient (R) of 0.826 and weighted average of 11.5%. Similarly, the statistical analysis conducted on geographies consisting of 283,297,538 people shows a weak positive correlation between the proportion of Immigrants from Nigeria and poverty level in the United States with a correlation coefficient (R) of 0.227 and weighted average of 13.5%, a difference of 18.1%.
Poverty Correlation Summary
| Measurement | Immigrants from South Africa | Immigrants from Nigeria |
| Minimum | 1.2% | 2.6% |
| Maximum | 54.5% | 29.2% |
| Range | 53.4% | 26.5% |
| Mean | 11.8% | 13.1% |
| Median | 9.3% | 11.9% |
| Interquartile 25% (IQ1) | 7.5% | 10.3% |
| Interquartile 75% (IQ3) | 13.4% | 16.1% |
| Interquartile Range (IQR) | 5.9% | 5.8% |
| Standard Deviation (Sample) | 10.2% | 5.1% |
| Standard Deviation (Population) | 10.0% | 5.1% |
Similar Demographics by Poverty
Demographics Similar to Immigrants from South Africa by Poverty
In terms of poverty, the demographic groups most similar to Immigrants from South Africa are Immigrants from Egypt (11.5%, a difference of 0.030%), Immigrants from Latvia (11.5%, a difference of 0.070%), Paraguayan (11.4%, a difference of 0.12%), Australian (11.4%, a difference of 0.12%), and Romanian (11.4%, a difference of 0.14%).
| Demographics | Rating | Rank | Poverty |
| Czechoslovakians | 95.7 /100 | #89 | Exceptional 11.4% |
| Immigrants | Denmark | 95.5 /100 | #90 | Exceptional 11.4% |
| Finns | 95.2 /100 | #91 | Exceptional 11.4% |
| British | 95.0 /100 | #92 | Exceptional 11.4% |
| Romanians | 94.9 /100 | #93 | Exceptional 11.4% |
| Paraguayans | 94.9 /100 | #94 | Exceptional 11.4% |
| Australians | 94.9 /100 | #95 | Exceptional 11.4% |
| Immigrants | South Africa | 94.7 /100 | #96 | Exceptional 11.5% |
| Immigrants | Egypt | 94.6 /100 | #97 | Exceptional 11.5% |
| Immigrants | Latvia | 94.5 /100 | #98 | Exceptional 11.5% |
| Immigrants | Indonesia | 94.2 /100 | #99 | Exceptional 11.5% |
| Scottish | 94.0 /100 | #100 | Exceptional 11.5% |
| Slavs | 93.3 /100 | #101 | Exceptional 11.5% |
| Laotians | 92.4 /100 | #102 | Exceptional 11.6% |
| Okinawans | 92.4 /100 | #103 | Exceptional 11.6% |
Demographics Similar to Immigrants from Nigeria by Poverty
In terms of poverty, the demographic groups most similar to Immigrants from Nigeria are Osage (13.6%, a difference of 0.24%), Alaskan Athabascan (13.6%, a difference of 0.30%), Alaska Native (13.5%, a difference of 0.45%), Nigerian (13.6%, a difference of 0.46%), and Marshallese (13.4%, a difference of 0.60%).
| Demographics | Rating | Rank | Poverty |
| Alsatians | 2.6 /100 | #221 | Tragic 13.4% |
| Immigrants | Micronesia | 2.6 /100 | #222 | Tragic 13.4% |
| Immigrants | Africa | 2.5 /100 | #223 | Tragic 13.4% |
| Immigrants | Eritrea | 2.4 /100 | #224 | Tragic 13.4% |
| German Russians | 2.2 /100 | #225 | Tragic 13.4% |
| Marshallese | 2.2 /100 | #226 | Tragic 13.4% |
| Alaska Natives | 2.1 /100 | #227 | Tragic 13.5% |
| Immigrants | Nigeria | 1.7 /100 | #228 | Tragic 13.5% |
| Osage | 1.5 /100 | #229 | Tragic 13.6% |
| Alaskan Athabascans | 1.5 /100 | #230 | Tragic 13.6% |
| Nigerians | 1.4 /100 | #231 | Tragic 13.6% |
| Fijians | 0.8 /100 | #232 | Tragic 13.7% |
| Immigrants | Saudi Arabia | 0.8 /100 | #233 | Tragic 13.8% |
| Immigrants | Laos | 0.7 /100 | #234 | Tragic 13.8% |
| Cubans | 0.6 /100 | #235 | Tragic 13.9% |