Immigrants from South Africa vs Immigrants from Haiti Poverty
COMPARE
Immigrants from South Africa
Immigrants from Haiti
Poverty
Poverty Comparison
Immigrants from South Africa
Immigrants from Haiti
11.5%
POVERTY
94.7/ 100
METRIC RATING
96th/ 347
METRIC RANK
15.0%
POVERTY
0.0/ 100
METRIC RATING
283rd/ 347
METRIC RANK
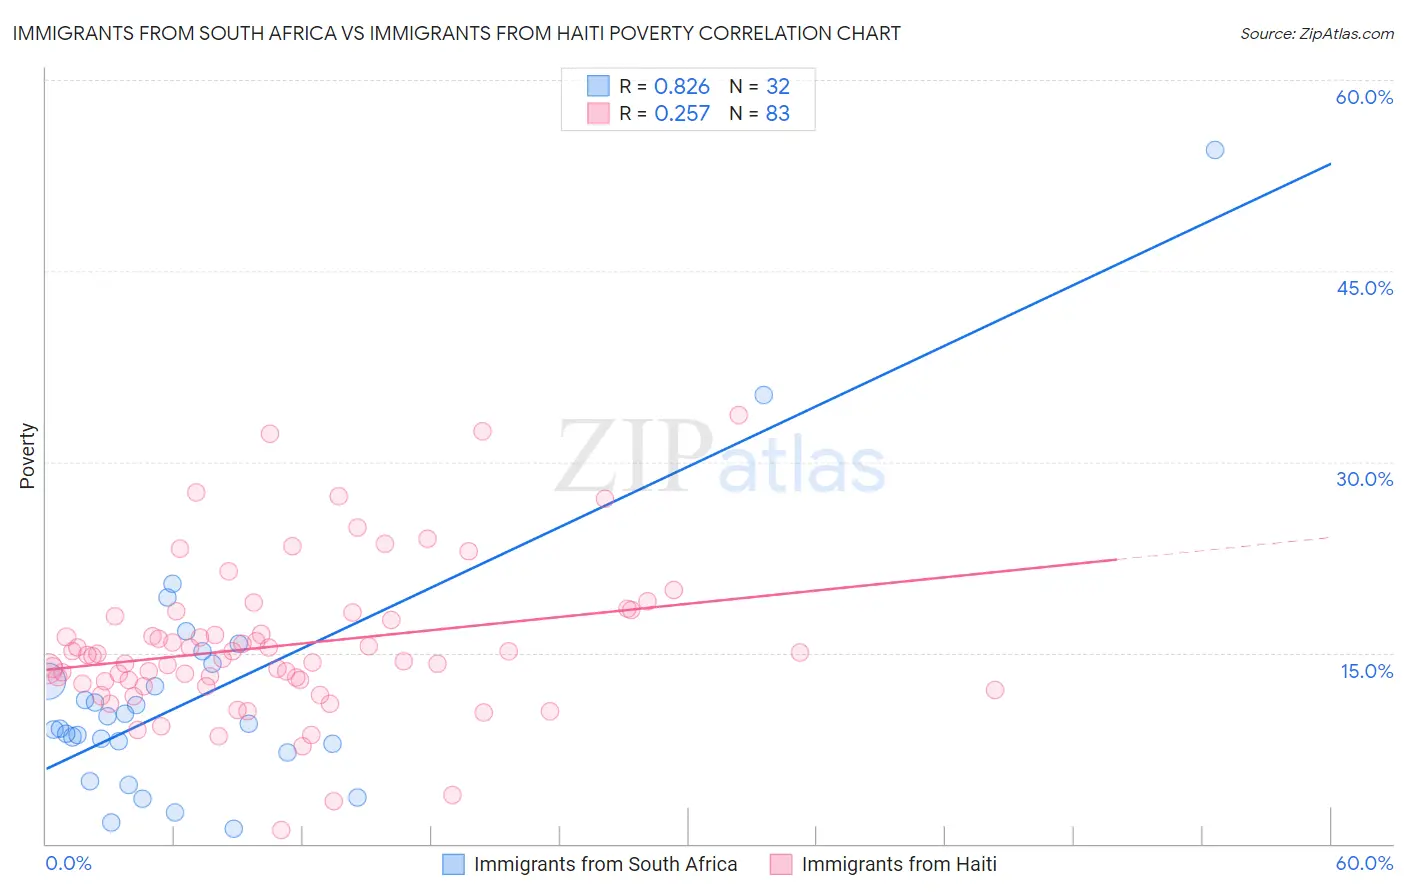
Immigrants from South Africa vs Immigrants from Haiti Poverty Correlation Chart
The statistical analysis conducted on geographies consisting of 233,262,094 people shows a very strong positive correlation between the proportion of Immigrants from South Africa and poverty level in the United States with a correlation coefficient (R) of 0.826 and weighted average of 11.5%. Similarly, the statistical analysis conducted on geographies consisting of 225,178,584 people shows a weak positive correlation between the proportion of Immigrants from Haiti and poverty level in the United States with a correlation coefficient (R) of 0.257 and weighted average of 15.0%, a difference of 30.6%.
Poverty Correlation Summary
| Measurement | Immigrants from South Africa | Immigrants from Haiti |
| Minimum | 1.2% | 1.1% |
| Maximum | 54.5% | 33.7% |
| Range | 53.4% | 32.7% |
| Mean | 11.8% | 15.6% |
| Median | 9.3% | 14.7% |
| Interquartile 25% (IQ1) | 7.5% | 12.6% |
| Interquartile 75% (IQ3) | 13.4% | 17.9% |
| Interquartile Range (IQR) | 5.9% | 5.3% |
| Standard Deviation (Sample) | 10.2% | 5.9% |
| Standard Deviation (Population) | 10.0% | 5.9% |
Similar Demographics by Poverty
Demographics Similar to Immigrants from South Africa by Poverty
In terms of poverty, the demographic groups most similar to Immigrants from South Africa are Immigrants from Egypt (11.5%, a difference of 0.030%), Immigrants from Latvia (11.5%, a difference of 0.070%), Paraguayan (11.4%, a difference of 0.12%), Australian (11.4%, a difference of 0.12%), and Romanian (11.4%, a difference of 0.14%).
| Demographics | Rating | Rank | Poverty |
| Czechoslovakians | 95.7 /100 | #89 | Exceptional 11.4% |
| Immigrants | Denmark | 95.5 /100 | #90 | Exceptional 11.4% |
| Finns | 95.2 /100 | #91 | Exceptional 11.4% |
| British | 95.0 /100 | #92 | Exceptional 11.4% |
| Romanians | 94.9 /100 | #93 | Exceptional 11.4% |
| Paraguayans | 94.9 /100 | #94 | Exceptional 11.4% |
| Australians | 94.9 /100 | #95 | Exceptional 11.4% |
| Immigrants | South Africa | 94.7 /100 | #96 | Exceptional 11.5% |
| Immigrants | Egypt | 94.6 /100 | #97 | Exceptional 11.5% |
| Immigrants | Latvia | 94.5 /100 | #98 | Exceptional 11.5% |
| Immigrants | Indonesia | 94.2 /100 | #99 | Exceptional 11.5% |
| Scottish | 94.0 /100 | #100 | Exceptional 11.5% |
| Slavs | 93.3 /100 | #101 | Exceptional 11.5% |
| Laotians | 92.4 /100 | #102 | Exceptional 11.6% |
| Okinawans | 92.4 /100 | #103 | Exceptional 11.6% |
Demographics Similar to Immigrants from Haiti by Poverty
In terms of poverty, the demographic groups most similar to Immigrants from Haiti are West Indian (15.0%, a difference of 0.10%), Comanche (15.0%, a difference of 0.12%), Vietnamese (15.0%, a difference of 0.16%), Immigrants from Latin America (15.0%, a difference of 0.42%), and Immigrants from Barbados (14.9%, a difference of 0.45%).
| Demographics | Rating | Rank | Poverty |
| Immigrants | Bahamas | 0.0 /100 | #276 | Tragic 14.8% |
| Bangladeshis | 0.0 /100 | #277 | Tragic 14.8% |
| Belizeans | 0.0 /100 | #278 | Tragic 14.8% |
| Immigrants | St. Vincent and the Grenadines | 0.0 /100 | #279 | Tragic 14.9% |
| Haitians | 0.0 /100 | #280 | Tragic 14.9% |
| Immigrants | Barbados | 0.0 /100 | #281 | Tragic 14.9% |
| Comanche | 0.0 /100 | #282 | Tragic 15.0% |
| Immigrants | Haiti | 0.0 /100 | #283 | Tragic 15.0% |
| West Indians | 0.0 /100 | #284 | Tragic 15.0% |
| Vietnamese | 0.0 /100 | #285 | Tragic 15.0% |
| Immigrants | Latin America | 0.0 /100 | #286 | Tragic 15.0% |
| Inupiat | 0.0 /100 | #287 | Tragic 15.1% |
| Yaqui | 0.0 /100 | #288 | Tragic 15.1% |
| Immigrants | Belize | 0.0 /100 | #289 | Tragic 15.1% |
| Mexicans | 0.0 /100 | #290 | Tragic 15.1% |