Immigrants from Poland vs Delaware Child Poverty Under the Age of 5
COMPARE
Immigrants from Poland
Delaware
Child Poverty Under the Age of 5
Child Poverty Under the Age of 5 Comparison
Immigrants from Poland
Delaware
15.1%
CHILD POVERTY UNDER THE AGE OF 5
99.1/ 100
METRIC RATING
61st/ 347
METRIC RANK
18.7%
CHILD POVERTY UNDER THE AGE OF 5
3.4/ 100
METRIC RATING
218th/ 347
METRIC RANK
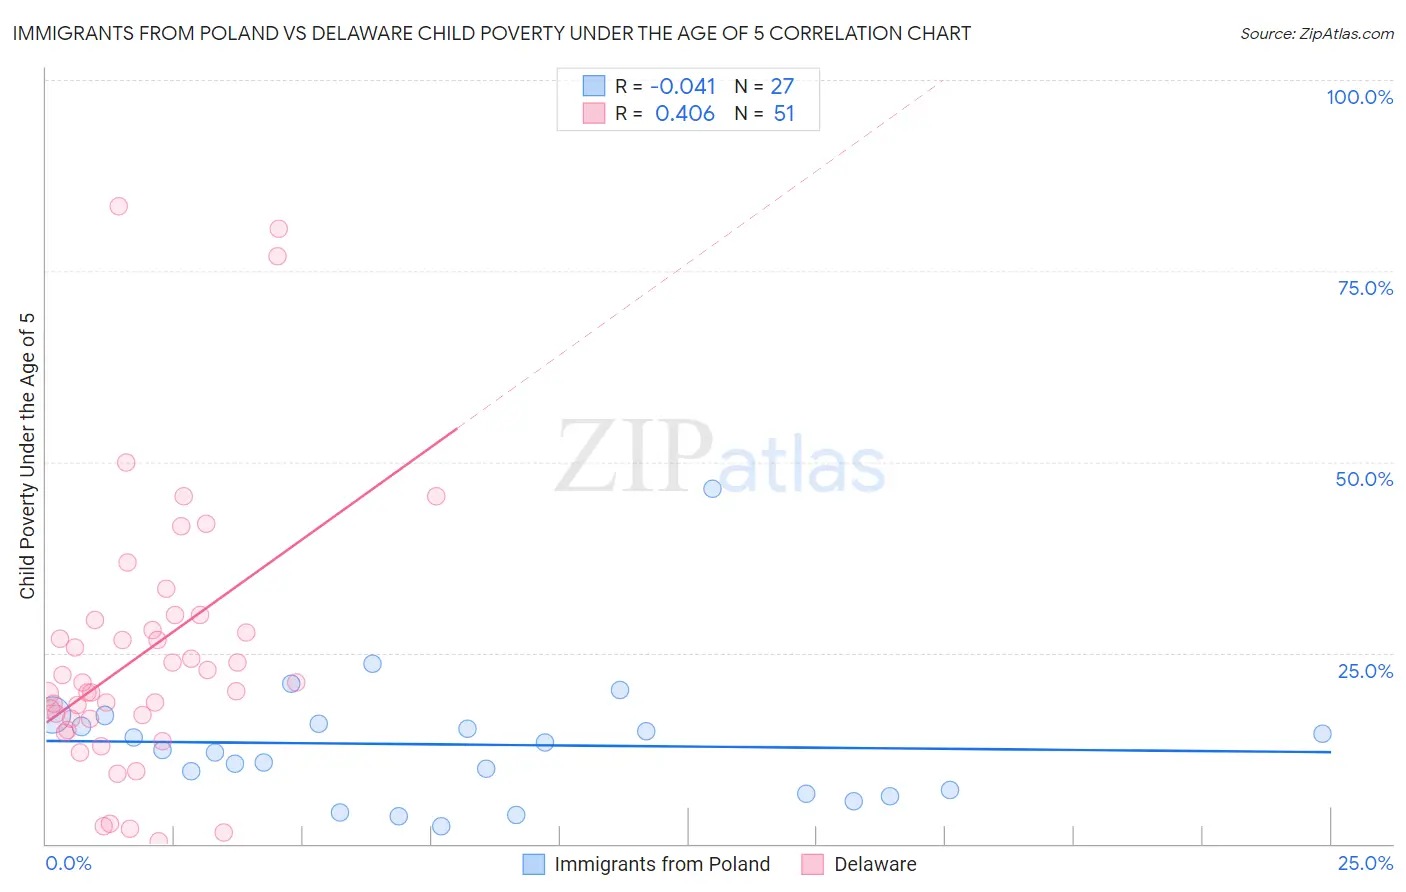
Immigrants from Poland vs Delaware Child Poverty Under the Age of 5 Correlation Chart
The statistical analysis conducted on geographies consisting of 290,713,862 people shows no correlation between the proportion of Immigrants from Poland and poverty level among children under the age of 5 in the United States with a correlation coefficient (R) of -0.041 and weighted average of 15.1%. Similarly, the statistical analysis conducted on geographies consisting of 94,801,216 people shows a moderate positive correlation between the proportion of Delaware and poverty level among children under the age of 5 in the United States with a correlation coefficient (R) of 0.406 and weighted average of 18.7%, a difference of 23.9%.
Child Poverty Under the Age of 5 Correlation Summary
| Measurement | Immigrants from Poland | Delaware |
| Minimum | 2.2% | 0.41% |
| Maximum | 46.5% | 83.5% |
| Range | 44.3% | 83.1% |
| Mean | 13.0% | 25.0% |
| Median | 12.3% | 21.1% |
| Interquartile 25% (IQ1) | 6.5% | 16.3% |
| Interquartile 75% (IQ3) | 15.7% | 29.2% |
| Interquartile Range (IQR) | 9.2% | 12.9% |
| Standard Deviation (Sample) | 8.7% | 17.9% |
| Standard Deviation (Population) | 8.6% | 17.7% |
Similar Demographics by Child Poverty Under the Age of 5
Demographics Similar to Immigrants from Poland by Child Poverty Under the Age of 5
In terms of child poverty under the age of 5, the demographic groups most similar to Immigrants from Poland are Immigrants from Eastern Europe (15.1%, a difference of 0.12%), Immigrants from Europe (15.1%, a difference of 0.25%), Immigrants from Romania (15.2%, a difference of 0.27%), Immigrants from Fiji (15.2%, a difference of 0.30%), and Immigrants from Scotland (15.2%, a difference of 0.42%).
| Demographics | Rating | Rank | Child Poverty Under the Age of 5 |
| Immigrants | Israel | 99.4 /100 | #54 | Exceptional 14.9% |
| Danes | 99.4 /100 | #55 | Exceptional 14.9% |
| Immigrants | Pakistan | 99.4 /100 | #56 | Exceptional 14.9% |
| Egyptians | 99.4 /100 | #57 | Exceptional 14.9% |
| Swedes | 99.4 /100 | #58 | Exceptional 15.0% |
| Paraguayans | 99.4 /100 | #59 | Exceptional 15.0% |
| Immigrants | Russia | 99.3 /100 | #60 | Exceptional 15.0% |
| Immigrants | Poland | 99.1 /100 | #61 | Exceptional 15.1% |
| Immigrants | Eastern Europe | 99.1 /100 | #62 | Exceptional 15.1% |
| Immigrants | Europe | 99.1 /100 | #63 | Exceptional 15.1% |
| Immigrants | Romania | 99.1 /100 | #64 | Exceptional 15.2% |
| Immigrants | Fiji | 99.0 /100 | #65 | Exceptional 15.2% |
| Immigrants | Scotland | 99.0 /100 | #66 | Exceptional 15.2% |
| Greeks | 99.0 /100 | #67 | Exceptional 15.2% |
| Zimbabweans | 99.0 /100 | #68 | Exceptional 15.2% |
Demographics Similar to Delaware by Child Poverty Under the Age of 5
In terms of child poverty under the age of 5, the demographic groups most similar to Delaware are German Russian (18.8%, a difference of 0.32%), Immigrants from the Azores (18.9%, a difference of 0.67%), Immigrants from Africa (18.6%, a difference of 0.75%), Hmong (18.5%, a difference of 0.95%), and Immigrants from Nigeria (19.0%, a difference of 1.2%).
| Demographics | Rating | Rank | Child Poverty Under the Age of 5 |
| Moroccans | 9.4 /100 | #211 | Tragic 18.2% |
| Nepalese | 8.7 /100 | #212 | Tragic 18.3% |
| Immigrants | Thailand | 8.6 /100 | #213 | Tragic 18.3% |
| Malaysians | 6.5 /100 | #214 | Tragic 18.4% |
| Immigrants | Panama | 6.0 /100 | #215 | Tragic 18.5% |
| Hmong | 5.0 /100 | #216 | Tragic 18.5% |
| Immigrants | Africa | 4.6 /100 | #217 | Tragic 18.6% |
| Delaware | 3.4 /100 | #218 | Tragic 18.7% |
| German Russians | 3.0 /100 | #219 | Tragic 18.8% |
| Immigrants | Azores | 2.6 /100 | #220 | Tragic 18.9% |
| Immigrants | Nigeria | 2.1 /100 | #221 | Tragic 19.0% |
| Alsatians | 1.7 /100 | #222 | Tragic 19.1% |
| Cubans | 1.7 /100 | #223 | Tragic 19.1% |
| Nicaraguans | 1.6 /100 | #224 | Tragic 19.1% |
| Nigerians | 1.6 /100 | #225 | Tragic 19.1% |