Immigrants from Chile vs Delaware Child Poverty Under the Age of 5
COMPARE
Immigrants from Chile
Delaware
Child Poverty Under the Age of 5
Child Poverty Under the Age of 5 Comparison
Immigrants from Chile
Delaware
16.4%
CHILD POVERTY UNDER THE AGE OF 5
85.3/ 100
METRIC RATING
137th/ 347
METRIC RANK
18.7%
CHILD POVERTY UNDER THE AGE OF 5
3.4/ 100
METRIC RATING
218th/ 347
METRIC RANK
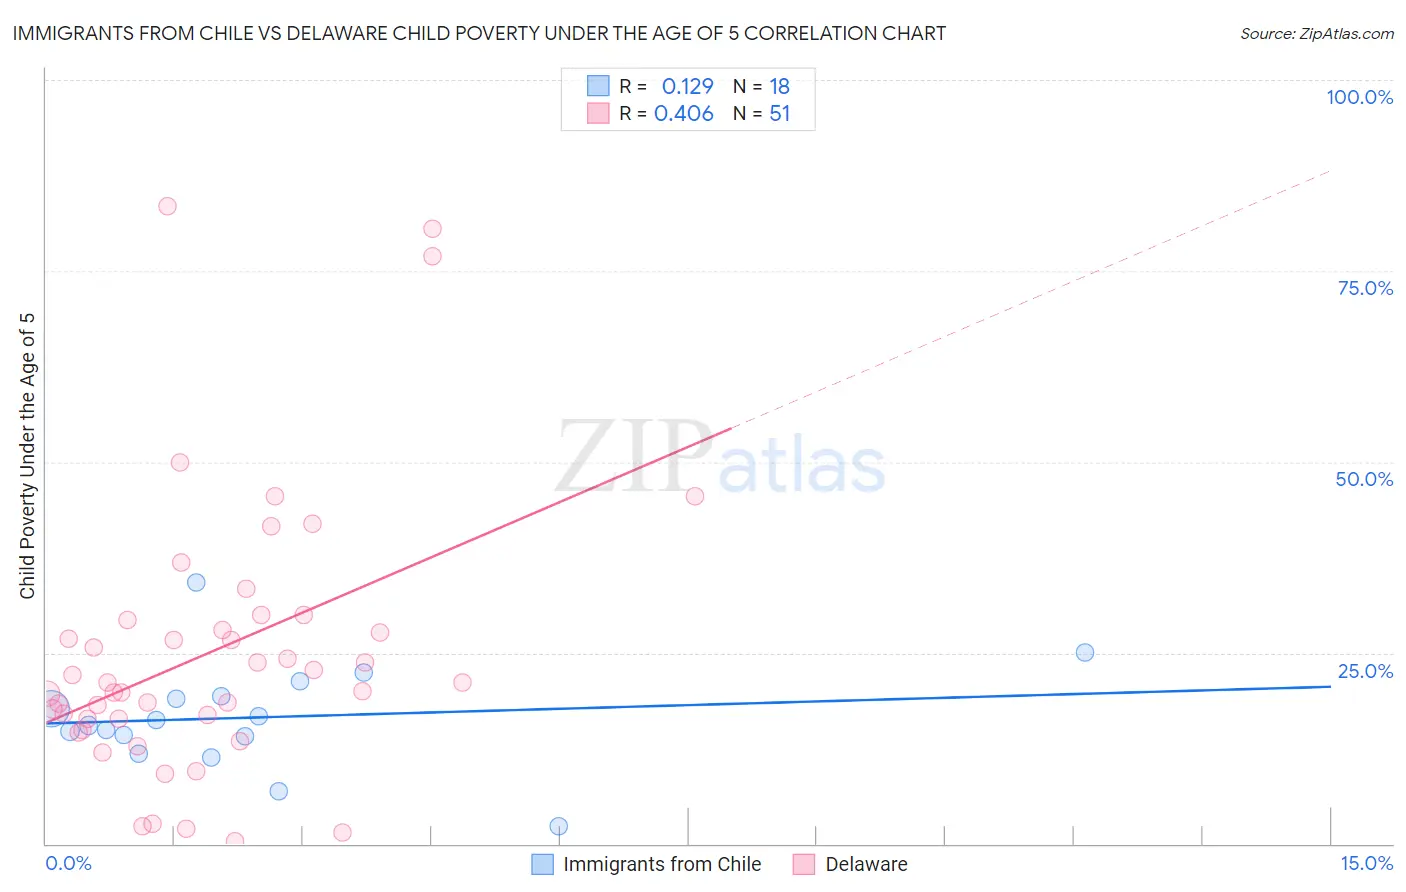
Immigrants from Chile vs Delaware Child Poverty Under the Age of 5 Correlation Chart
The statistical analysis conducted on geographies consisting of 213,144,685 people shows a poor positive correlation between the proportion of Immigrants from Chile and poverty level among children under the age of 5 in the United States with a correlation coefficient (R) of 0.129 and weighted average of 16.4%. Similarly, the statistical analysis conducted on geographies consisting of 94,801,216 people shows a moderate positive correlation between the proportion of Delaware and poverty level among children under the age of 5 in the United States with a correlation coefficient (R) of 0.406 and weighted average of 18.7%, a difference of 13.9%.
Child Poverty Under the Age of 5 Correlation Summary
| Measurement | Immigrants from Chile | Delaware |
| Minimum | 2.3% | 0.41% |
| Maximum | 34.3% | 83.5% |
| Range | 32.0% | 83.1% |
| Mean | 16.5% | 25.0% |
| Median | 15.9% | 21.1% |
| Interquartile 25% (IQ1) | 14.0% | 16.3% |
| Interquartile 75% (IQ3) | 19.4% | 29.2% |
| Interquartile Range (IQR) | 5.3% | 12.9% |
| Standard Deviation (Sample) | 7.0% | 17.9% |
| Standard Deviation (Population) | 6.8% | 17.7% |
Similar Demographics by Child Poverty Under the Age of 5
Demographics Similar to Immigrants from Chile by Child Poverty Under the Age of 5
In terms of child poverty under the age of 5, the demographic groups most similar to Immigrants from Chile are German (16.5%, a difference of 0.10%), Immigrants from Hungary (16.5%, a difference of 0.16%), Guamanian/Chamorro (16.5%, a difference of 0.23%), Immigrants from Western Europe (16.5%, a difference of 0.42%), and Portuguese (16.5%, a difference of 0.46%).
| Demographics | Rating | Rank | Child Poverty Under the Age of 5 |
| Immigrants | Norway | 89.3 /100 | #130 | Excellent 16.3% |
| Finns | 88.3 /100 | #131 | Excellent 16.3% |
| Serbians | 88.2 /100 | #132 | Excellent 16.3% |
| Icelanders | 87.9 /100 | #133 | Excellent 16.3% |
| Immigrants | North Macedonia | 87.8 /100 | #134 | Excellent 16.4% |
| Brazilians | 87.8 /100 | #135 | Excellent 16.4% |
| Immigrants | Northern Africa | 87.5 /100 | #136 | Excellent 16.4% |
| Immigrants | Chile | 85.3 /100 | #137 | Excellent 16.4% |
| Germans | 84.8 /100 | #138 | Excellent 16.5% |
| Immigrants | Hungary | 84.5 /100 | #139 | Excellent 16.5% |
| Guamanians/Chamorros | 84.2 /100 | #140 | Excellent 16.5% |
| Immigrants | Western Europe | 83.3 /100 | #141 | Excellent 16.5% |
| Portuguese | 83.0 /100 | #142 | Excellent 16.5% |
| Samoans | 83.0 /100 | #143 | Excellent 16.5% |
| Ethiopians | 82.7 /100 | #144 | Excellent 16.5% |
Demographics Similar to Delaware by Child Poverty Under the Age of 5
In terms of child poverty under the age of 5, the demographic groups most similar to Delaware are German Russian (18.8%, a difference of 0.32%), Immigrants from the Azores (18.9%, a difference of 0.67%), Immigrants from Africa (18.6%, a difference of 0.75%), Hmong (18.5%, a difference of 0.95%), and Immigrants from Nigeria (19.0%, a difference of 1.2%).
| Demographics | Rating | Rank | Child Poverty Under the Age of 5 |
| Moroccans | 9.4 /100 | #211 | Tragic 18.2% |
| Nepalese | 8.7 /100 | #212 | Tragic 18.3% |
| Immigrants | Thailand | 8.6 /100 | #213 | Tragic 18.3% |
| Malaysians | 6.5 /100 | #214 | Tragic 18.4% |
| Immigrants | Panama | 6.0 /100 | #215 | Tragic 18.5% |
| Hmong | 5.0 /100 | #216 | Tragic 18.5% |
| Immigrants | Africa | 4.6 /100 | #217 | Tragic 18.6% |
| Delaware | 3.4 /100 | #218 | Tragic 18.7% |
| German Russians | 3.0 /100 | #219 | Tragic 18.8% |
| Immigrants | Azores | 2.6 /100 | #220 | Tragic 18.9% |
| Immigrants | Nigeria | 2.1 /100 | #221 | Tragic 19.0% |
| Alsatians | 1.7 /100 | #222 | Tragic 19.1% |
| Cubans | 1.7 /100 | #223 | Tragic 19.1% |
| Nicaraguans | 1.6 /100 | #224 | Tragic 19.1% |
| Nigerians | 1.6 /100 | #225 | Tragic 19.1% |