Immigrants from Poland vs Belgian Child Poverty Under the Age of 5
COMPARE
Immigrants from Poland
Belgian
Child Poverty Under the Age of 5
Child Poverty Under the Age of 5 Comparison
Immigrants from Poland
Belgians
15.1%
CHILD POVERTY UNDER THE AGE OF 5
99.1/ 100
METRIC RATING
61st/ 347
METRIC RANK
16.7%
CHILD POVERTY UNDER THE AGE OF 5
77.2/ 100
METRIC RATING
152nd/ 347
METRIC RANK
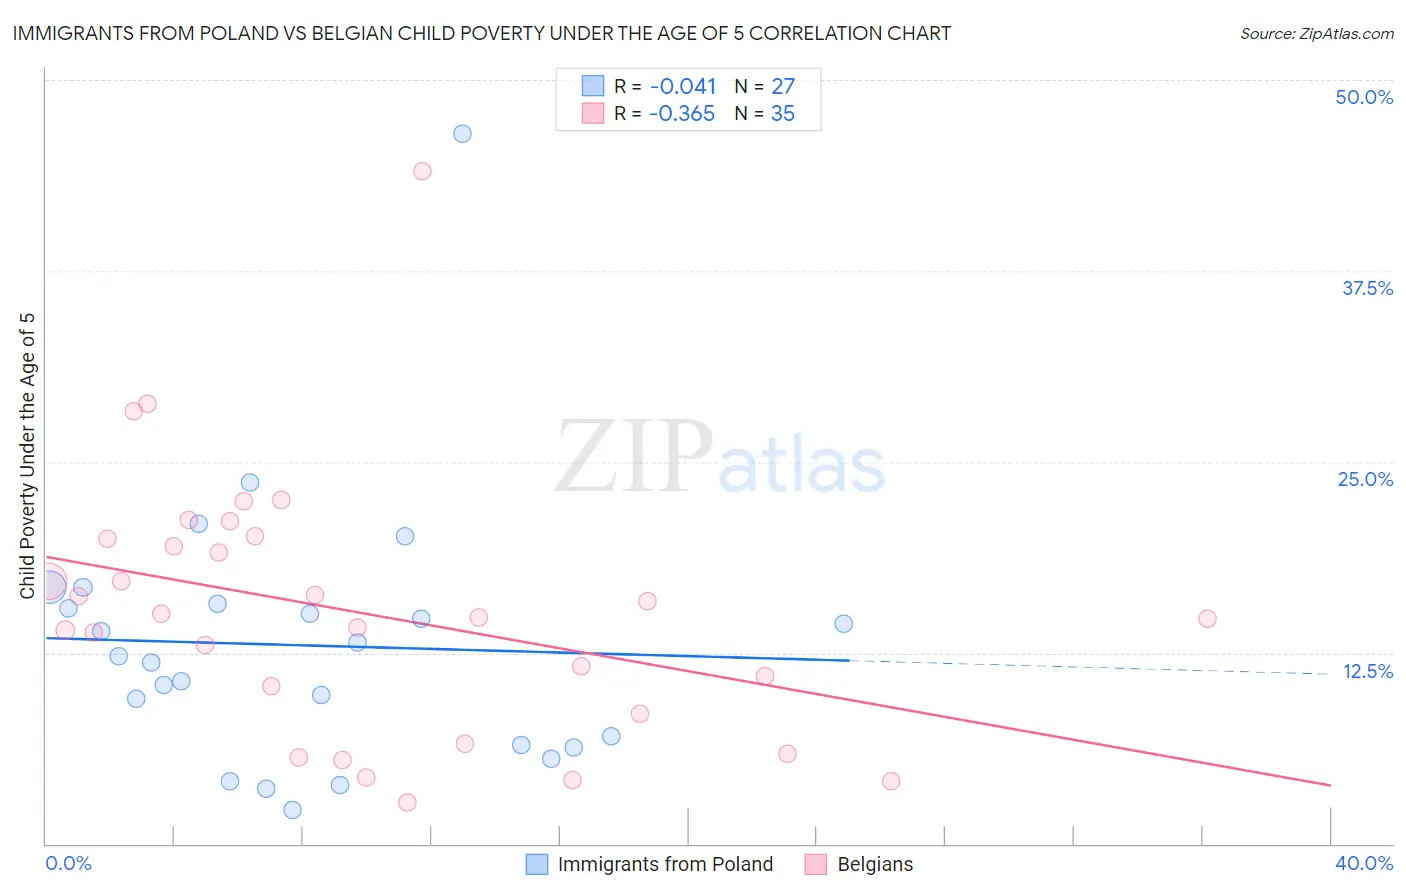
Immigrants from Poland vs Belgian Child Poverty Under the Age of 5 Correlation Chart
The statistical analysis conducted on geographies consisting of 290,713,862 people shows no correlation between the proportion of Immigrants from Poland and poverty level among children under the age of 5 in the United States with a correlation coefficient (R) of -0.041 and weighted average of 15.1%. Similarly, the statistical analysis conducted on geographies consisting of 339,700,992 people shows a mild negative correlation between the proportion of Belgians and poverty level among children under the age of 5 in the United States with a correlation coefficient (R) of -0.365 and weighted average of 16.7%, a difference of 10.4%.
Child Poverty Under the Age of 5 Correlation Summary
| Measurement | Immigrants from Poland | Belgian |
| Minimum | 2.2% | 2.7% |
| Maximum | 46.5% | 44.0% |
| Range | 44.3% | 41.3% |
| Mean | 13.0% | 15.1% |
| Median | 12.3% | 14.9% |
| Interquartile 25% (IQ1) | 6.5% | 8.5% |
| Interquartile 75% (IQ3) | 15.7% | 20.0% |
| Interquartile Range (IQR) | 9.2% | 11.5% |
| Standard Deviation (Sample) | 8.7% | 8.5% |
| Standard Deviation (Population) | 8.6% | 8.3% |
Similar Demographics by Child Poverty Under the Age of 5
Demographics Similar to Immigrants from Poland by Child Poverty Under the Age of 5
In terms of child poverty under the age of 5, the demographic groups most similar to Immigrants from Poland are Immigrants from Eastern Europe (15.1%, a difference of 0.12%), Immigrants from Europe (15.1%, a difference of 0.25%), Immigrants from Romania (15.2%, a difference of 0.27%), Immigrants from Fiji (15.2%, a difference of 0.30%), and Immigrants from Scotland (15.2%, a difference of 0.42%).
| Demographics | Rating | Rank | Child Poverty Under the Age of 5 |
| Immigrants | Israel | 99.4 /100 | #54 | Exceptional 14.9% |
| Danes | 99.4 /100 | #55 | Exceptional 14.9% |
| Immigrants | Pakistan | 99.4 /100 | #56 | Exceptional 14.9% |
| Egyptians | 99.4 /100 | #57 | Exceptional 14.9% |
| Swedes | 99.4 /100 | #58 | Exceptional 15.0% |
| Paraguayans | 99.4 /100 | #59 | Exceptional 15.0% |
| Immigrants | Russia | 99.3 /100 | #60 | Exceptional 15.0% |
| Immigrants | Poland | 99.1 /100 | #61 | Exceptional 15.1% |
| Immigrants | Eastern Europe | 99.1 /100 | #62 | Exceptional 15.1% |
| Immigrants | Europe | 99.1 /100 | #63 | Exceptional 15.1% |
| Immigrants | Romania | 99.1 /100 | #64 | Exceptional 15.2% |
| Immigrants | Fiji | 99.0 /100 | #65 | Exceptional 15.2% |
| Immigrants | Scotland | 99.0 /100 | #66 | Exceptional 15.2% |
| Greeks | 99.0 /100 | #67 | Exceptional 15.2% |
| Zimbabweans | 99.0 /100 | #68 | Exceptional 15.2% |
Demographics Similar to Belgians by Child Poverty Under the Age of 5
In terms of child poverty under the age of 5, the demographic groups most similar to Belgians are Dutch (16.7%, a difference of 0.020%), Canadian (16.7%, a difference of 0.060%), Colombian (16.7%, a difference of 0.10%), Immigrants from Venezuela (16.7%, a difference of 0.18%), and New Zealander (16.6%, a difference of 0.24%).
| Demographics | Rating | Rank | Child Poverty Under the Age of 5 |
| Immigrants | Ethiopia | 82.1 /100 | #145 | Excellent 16.6% |
| Israelis | 82.0 /100 | #146 | Excellent 16.6% |
| Immigrants | Nepal | 80.3 /100 | #147 | Excellent 16.6% |
| Syrians | 79.1 /100 | #148 | Good 16.6% |
| New Zealanders | 78.7 /100 | #149 | Good 16.6% |
| Colombians | 77.8 /100 | #150 | Good 16.7% |
| Canadians | 77.6 /100 | #151 | Good 16.7% |
| Belgians | 77.2 /100 | #152 | Good 16.7% |
| Dutch | 77.1 /100 | #153 | Good 16.7% |
| Immigrants | Venezuela | 76.0 /100 | #154 | Good 16.7% |
| South Americans | 75.1 /100 | #155 | Good 16.7% |
| Afghans | 74.4 /100 | #156 | Good 16.8% |
| Venezuelans | 73.7 /100 | #157 | Good 16.8% |
| Czechoslovakians | 72.5 /100 | #158 | Good 16.8% |
| Immigrants | Syria | 72.3 /100 | #159 | Good 16.8% |