Immigrants from Pakistan vs Salvadoran Receiving Food Stamps
COMPARE
Immigrants from Pakistan
Salvadoran
Receiving Food Stamps
Receiving Food Stamps Comparison
Immigrants from Pakistan
Salvadorans
10.4%
RECEIVING FOOD STAMPS
96.2/ 100
METRIC RATING
109th/ 347
METRIC RANK
13.2%
RECEIVING FOOD STAMPS
2.7/ 100
METRIC RATING
232nd/ 347
METRIC RANK
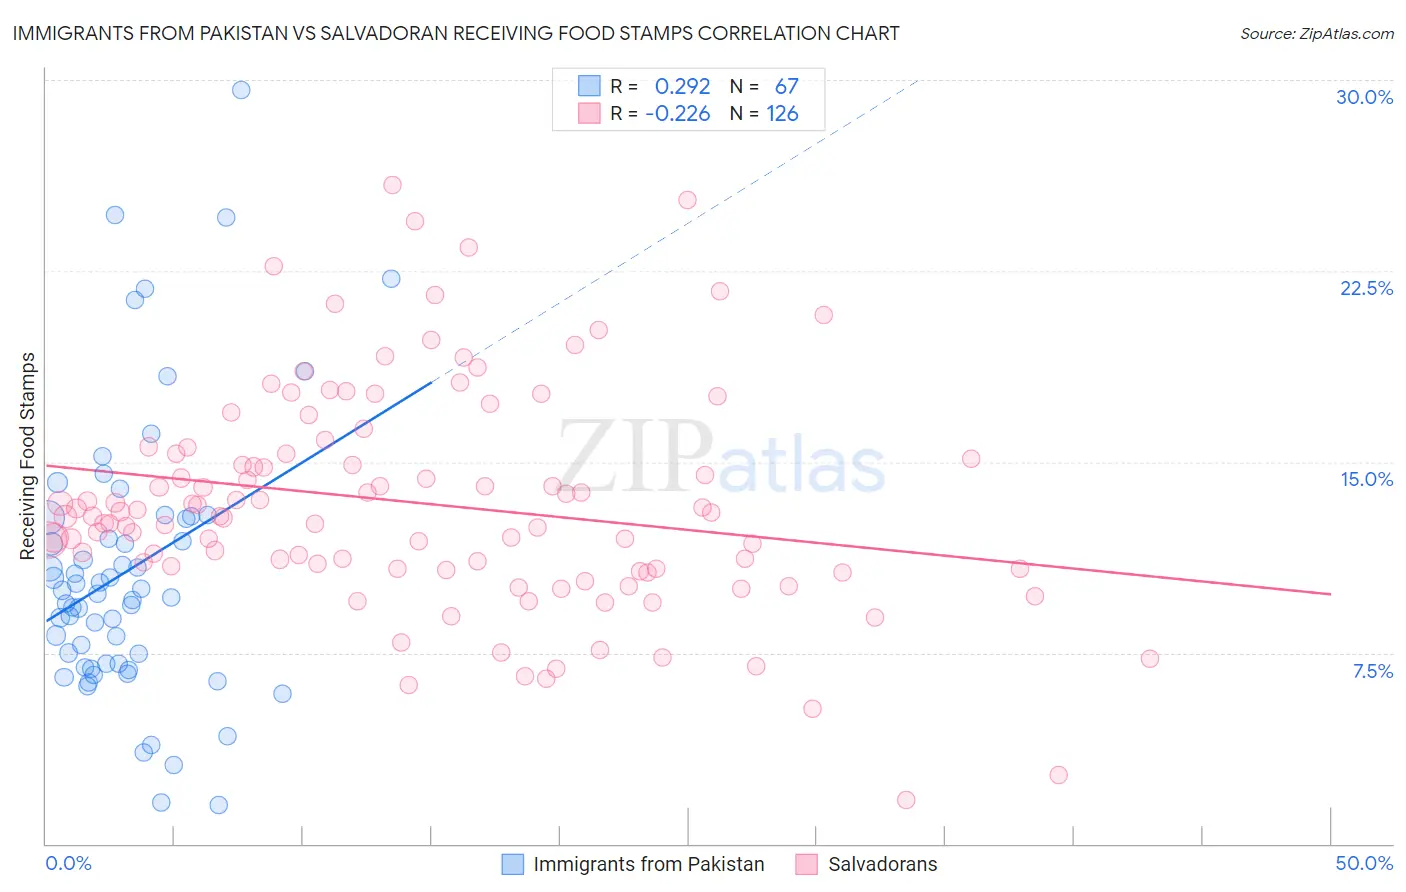
Immigrants from Pakistan vs Salvadoran Receiving Food Stamps Correlation Chart
The statistical analysis conducted on geographies consisting of 283,345,701 people shows a weak positive correlation between the proportion of Immigrants from Pakistan and percentage of population receiving government assistance and/or food stamps in the United States with a correlation coefficient (R) of 0.292 and weighted average of 10.4%. Similarly, the statistical analysis conducted on geographies consisting of 398,082,063 people shows a weak negative correlation between the proportion of Salvadorans and percentage of population receiving government assistance and/or food stamps in the United States with a correlation coefficient (R) of -0.226 and weighted average of 13.2%, a difference of 26.9%.
Receiving Food Stamps Correlation Summary
| Measurement | Immigrants from Pakistan | Salvadoran |
| Minimum | 1.5% | 1.7% |
| Maximum | 29.6% | 25.9% |
| Range | 28.1% | 24.2% |
| Mean | 10.8% | 13.4% |
| Median | 9.8% | 12.9% |
| Interquartile 25% (IQ1) | 7.1% | 10.8% |
| Interquartile 75% (IQ3) | 12.8% | 15.3% |
| Interquartile Range (IQR) | 5.7% | 4.5% |
| Standard Deviation (Sample) | 5.5% | 4.4% |
| Standard Deviation (Population) | 5.4% | 4.3% |
Similar Demographics by Receiving Food Stamps
Demographics Similar to Immigrants from Pakistan by Receiving Food Stamps
In terms of receiving food stamps, the demographic groups most similar to Immigrants from Pakistan are Carpatho Rusyn (10.4%, a difference of 0.040%), Korean (10.4%, a difference of 0.080%), Immigrants from Italy (10.4%, a difference of 0.23%), Pakistani (10.4%, a difference of 0.28%), and Immigrants from Malaysia (10.4%, a difference of 0.32%).
| Demographics | Rating | Rank | Receiving Food Stamps |
| Immigrants | Europe | 96.8 /100 | #102 | Exceptional 10.3% |
| Immigrants | Latvia | 96.8 /100 | #103 | Exceptional 10.3% |
| Immigrants | Hungary | 96.7 /100 | #104 | Exceptional 10.3% |
| Immigrants | Malaysia | 96.5 /100 | #105 | Exceptional 10.4% |
| Immigrants | Italy | 96.4 /100 | #106 | Exceptional 10.4% |
| Koreans | 96.3 /100 | #107 | Exceptional 10.4% |
| Carpatho Rusyns | 96.2 /100 | #108 | Exceptional 10.4% |
| Immigrants | Pakistan | 96.2 /100 | #109 | Exceptional 10.4% |
| Pakistanis | 95.9 /100 | #110 | Exceptional 10.4% |
| Romanians | 95.8 /100 | #111 | Exceptional 10.4% |
| Mongolians | 95.8 /100 | #112 | Exceptional 10.5% |
| Icelanders | 95.4 /100 | #113 | Exceptional 10.5% |
| Scotch-Irish | 95.1 /100 | #114 | Exceptional 10.5% |
| Immigrants | Saudi Arabia | 94.9 /100 | #115 | Exceptional 10.5% |
| Canadians | 94.8 /100 | #116 | Exceptional 10.5% |
Demographics Similar to Salvadorans by Receiving Food Stamps
In terms of receiving food stamps, the demographic groups most similar to Salvadorans are Cherokee (13.2%, a difference of 0.26%), Comanche (13.3%, a difference of 0.38%), Immigrants from Nigeria (13.1%, a difference of 0.73%), Puget Sound Salish (13.1%, a difference of 0.77%), and Ottawa (13.1%, a difference of 0.82%).
| Demographics | Rating | Rank | Receiving Food Stamps |
| Fijians | 4.3 /100 | #225 | Tragic 13.0% |
| Chickasaw | 3.6 /100 | #226 | Tragic 13.1% |
| Nigerians | 3.5 /100 | #227 | Tragic 13.1% |
| Panamanians | 3.5 /100 | #228 | Tragic 13.1% |
| Ottawa | 3.5 /100 | #229 | Tragic 13.1% |
| Puget Sound Salish | 3.4 /100 | #230 | Tragic 13.1% |
| Immigrants | Nigeria | 3.4 /100 | #231 | Tragic 13.1% |
| Salvadorans | 2.7 /100 | #232 | Tragic 13.2% |
| Cherokee | 2.5 /100 | #233 | Tragic 13.2% |
| Comanche | 2.4 /100 | #234 | Tragic 13.3% |
| Immigrants | Zaire | 1.9 /100 | #235 | Tragic 13.4% |
| Crow | 1.6 /100 | #236 | Tragic 13.4% |
| Immigrants | El Salvador | 1.5 /100 | #237 | Tragic 13.5% |
| French American Indians | 1.4 /100 | #238 | Tragic 13.5% |
| Immigrants | Micronesia | 1.3 /100 | #239 | Tragic 13.5% |