Immigrants from Nicaragua vs Hmong Family Poverty
COMPARE
Immigrants from Nicaragua
Hmong
Family Poverty
Family Poverty Comparison
Immigrants from Nicaragua
Hmong
11.1%
FAMILY POVERTY
0.1/ 100
METRIC RATING
270th/ 347
METRIC RANK
9.1%
FAMILY POVERTY
40.2/ 100
METRIC RATING
181st/ 347
METRIC RANK
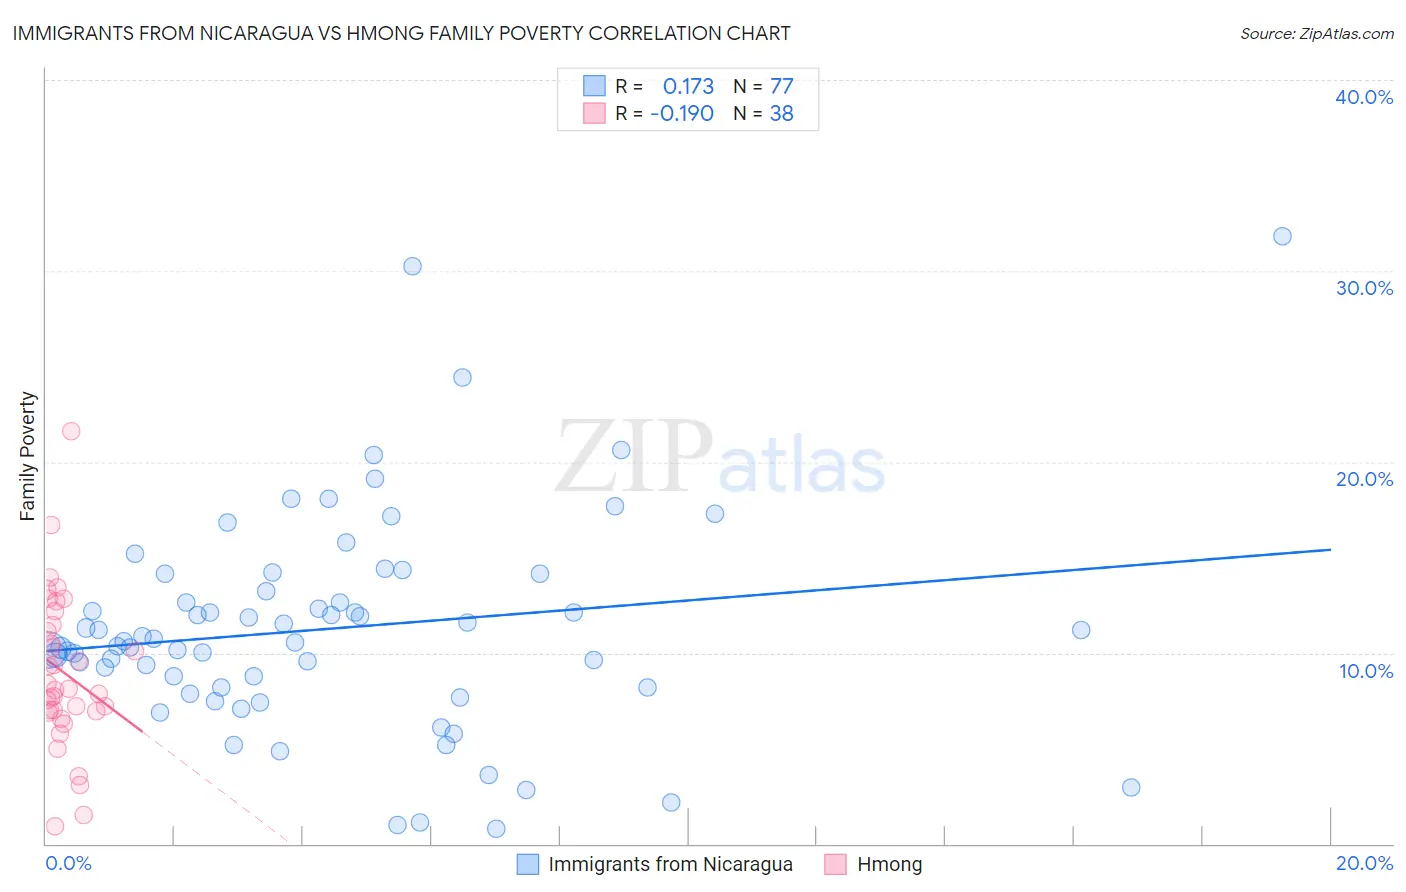
Immigrants from Nicaragua vs Hmong Family Poverty Correlation Chart
The statistical analysis conducted on geographies consisting of 236,234,574 people shows a poor positive correlation between the proportion of Immigrants from Nicaragua and poverty level among families in the United States with a correlation coefficient (R) of 0.173 and weighted average of 11.1%. Similarly, the statistical analysis conducted on geographies consisting of 24,669,739 people shows a poor negative correlation between the proportion of Hmong and poverty level among families in the United States with a correlation coefficient (R) of -0.190 and weighted average of 9.1%, a difference of 21.8%.
Family Poverty Correlation Summary
| Measurement | Immigrants from Nicaragua | Hmong |
| Minimum | 0.77% | 0.91% |
| Maximum | 31.8% | 21.6% |
| Range | 31.0% | 20.7% |
| Mean | 11.3% | 9.0% |
| Median | 10.6% | 8.1% |
| Interquartile 25% (IQ1) | 8.2% | 7.0% |
| Interquartile 75% (IQ3) | 13.7% | 11.4% |
| Interquartile Range (IQR) | 5.5% | 4.5% |
| Standard Deviation (Sample) | 5.7% | 4.1% |
| Standard Deviation (Population) | 5.6% | 4.0% |
Similar Demographics by Family Poverty
Demographics Similar to Immigrants from Nicaragua by Family Poverty
In terms of family poverty, the demographic groups most similar to Immigrants from Nicaragua are Immigrants from Ecuador (11.1%, a difference of 0.010%), Immigrants from Bahamas (11.1%, a difference of 0.25%), Immigrants from Jamaica (11.2%, a difference of 0.34%), Jamaican (11.1%, a difference of 0.49%), and Comanche (11.0%, a difference of 0.59%).
| Demographics | Rating | Rank | Family Poverty |
| Cape Verdeans | 0.1 /100 | #263 | Tragic 10.9% |
| Trinidadians and Tobagonians | 0.1 /100 | #264 | Tragic 10.9% |
| Immigrants | Trinidad and Tobago | 0.1 /100 | #265 | Tragic 10.9% |
| Immigrants | El Salvador | 0.1 /100 | #266 | Tragic 11.0% |
| Comanche | 0.1 /100 | #267 | Tragic 11.0% |
| Jamaicans | 0.1 /100 | #268 | Tragic 11.1% |
| Immigrants | Ecuador | 0.1 /100 | #269 | Tragic 11.1% |
| Immigrants | Nicaragua | 0.1 /100 | #270 | Tragic 11.1% |
| Immigrants | Bahamas | 0.1 /100 | #271 | Tragic 11.1% |
| Immigrants | Jamaica | 0.1 /100 | #272 | Tragic 11.2% |
| Somalis | 0.1 /100 | #273 | Tragic 11.2% |
| Spanish Americans | 0.1 /100 | #274 | Tragic 11.2% |
| Central Americans | 0.1 /100 | #275 | Tragic 11.2% |
| Immigrants | Guyana | 0.1 /100 | #276 | Tragic 11.2% |
| Chippewa | 0.1 /100 | #277 | Tragic 11.2% |
Demographics Similar to Hmong by Family Poverty
In terms of family poverty, the demographic groups most similar to Hmong are Immigrants from Morocco (9.1%, a difference of 0.010%), Uruguayan (9.1%, a difference of 0.14%), South American Indian (9.1%, a difference of 0.21%), Immigrants from Saudi Arabia (9.1%, a difference of 0.22%), and Immigrants from Uganda (9.1%, a difference of 0.43%).
| Demographics | Rating | Rank | Family Poverty |
| Immigrants | Albania | 50.0 /100 | #174 | Average 9.0% |
| Costa Ricans | 49.3 /100 | #175 | Average 9.0% |
| Immigrants | Syria | 47.5 /100 | #176 | Average 9.0% |
| Hawaiians | 47.2 /100 | #177 | Average 9.0% |
| Immigrants | Cameroon | 47.1 /100 | #178 | Average 9.0% |
| Immigrants | Iraq | 44.4 /100 | #179 | Average 9.1% |
| Immigrants | Uganda | 43.4 /100 | #180 | Average 9.1% |
| Hmong | 40.2 /100 | #181 | Average 9.1% |
| Immigrants | Morocco | 40.2 /100 | #182 | Average 9.1% |
| Uruguayans | 39.2 /100 | #183 | Fair 9.1% |
| South American Indians | 38.7 /100 | #184 | Fair 9.1% |
| Immigrants | Saudi Arabia | 38.6 /100 | #185 | Fair 9.1% |
| Colombians | 36.1 /100 | #186 | Fair 9.2% |
| Delaware | 35.4 /100 | #187 | Fair 9.2% |
| Immigrants | Kenya | 34.0 /100 | #188 | Fair 9.2% |