Immigrants from Nicaragua vs Native/Alaskan Family Poverty
COMPARE
Immigrants from Nicaragua
Native/Alaskan
Family Poverty
Family Poverty Comparison
Immigrants from Nicaragua
Natives/Alaskans
11.1%
FAMILY POVERTY
0.1/ 100
METRIC RATING
270th/ 347
METRIC RANK
14.3%
FAMILY POVERTY
0.0/ 100
METRIC RATING
330th/ 347
METRIC RANK
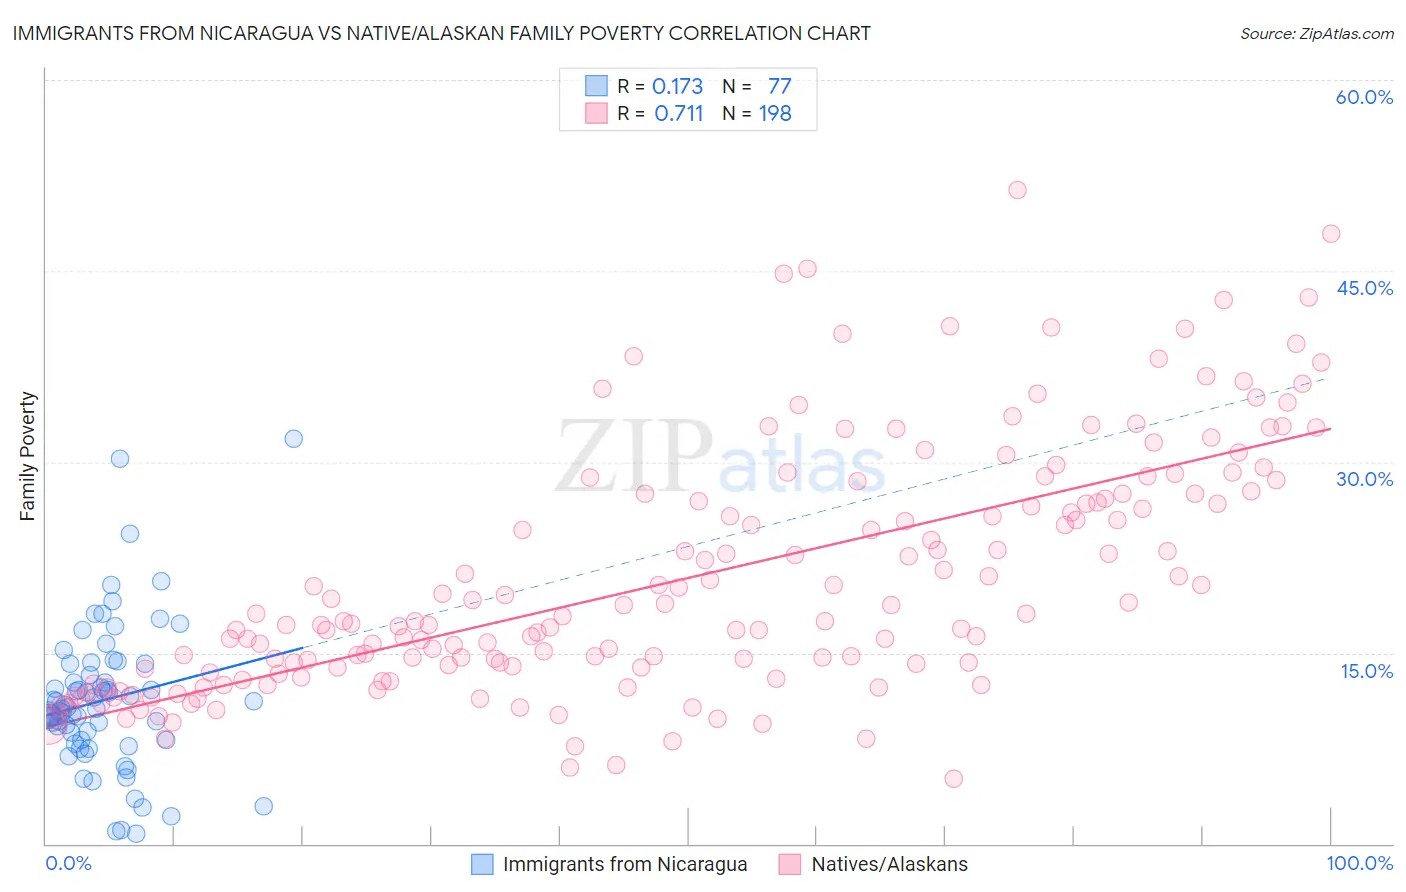
Immigrants from Nicaragua vs Native/Alaskan Family Poverty Correlation Chart
The statistical analysis conducted on geographies consisting of 236,234,574 people shows a poor positive correlation between the proportion of Immigrants from Nicaragua and poverty level among families in the United States with a correlation coefficient (R) of 0.173 and weighted average of 11.1%. Similarly, the statistical analysis conducted on geographies consisting of 511,183,066 people shows a strong positive correlation between the proportion of Natives/Alaskans and poverty level among families in the United States with a correlation coefficient (R) of 0.711 and weighted average of 14.3%, a difference of 28.3%.
Family Poverty Correlation Summary
| Measurement | Immigrants from Nicaragua | Native/Alaskan |
| Minimum | 0.77% | 5.1% |
| Maximum | 31.8% | 51.4% |
| Range | 31.0% | 46.3% |
| Mean | 11.3% | 20.9% |
| Median | 10.6% | 17.5% |
| Interquartile 25% (IQ1) | 8.2% | 13.7% |
| Interquartile 75% (IQ3) | 13.7% | 27.5% |
| Interquartile Range (IQR) | 5.5% | 13.8% |
| Standard Deviation (Sample) | 5.7% | 9.6% |
| Standard Deviation (Population) | 5.6% | 9.6% |
Similar Demographics by Family Poverty
Demographics Similar to Immigrants from Nicaragua by Family Poverty
In terms of family poverty, the demographic groups most similar to Immigrants from Nicaragua are Immigrants from Ecuador (11.1%, a difference of 0.010%), Immigrants from Bahamas (11.1%, a difference of 0.25%), Immigrants from Jamaica (11.2%, a difference of 0.34%), Jamaican (11.1%, a difference of 0.49%), and Comanche (11.0%, a difference of 0.59%).
| Demographics | Rating | Rank | Family Poverty |
| Cape Verdeans | 0.1 /100 | #263 | Tragic 10.9% |
| Trinidadians and Tobagonians | 0.1 /100 | #264 | Tragic 10.9% |
| Immigrants | Trinidad and Tobago | 0.1 /100 | #265 | Tragic 10.9% |
| Immigrants | El Salvador | 0.1 /100 | #266 | Tragic 11.0% |
| Comanche | 0.1 /100 | #267 | Tragic 11.0% |
| Jamaicans | 0.1 /100 | #268 | Tragic 11.1% |
| Immigrants | Ecuador | 0.1 /100 | #269 | Tragic 11.1% |
| Immigrants | Nicaragua | 0.1 /100 | #270 | Tragic 11.1% |
| Immigrants | Bahamas | 0.1 /100 | #271 | Tragic 11.1% |
| Immigrants | Jamaica | 0.1 /100 | #272 | Tragic 11.2% |
| Somalis | 0.1 /100 | #273 | Tragic 11.2% |
| Spanish Americans | 0.1 /100 | #274 | Tragic 11.2% |
| Central Americans | 0.1 /100 | #275 | Tragic 11.2% |
| Immigrants | Guyana | 0.1 /100 | #276 | Tragic 11.2% |
| Chippewa | 0.1 /100 | #277 | Tragic 11.2% |
Demographics Similar to Natives/Alaskans by Family Poverty
In terms of family poverty, the demographic groups most similar to Natives/Alaskans are Cheyenne (14.3%, a difference of 0.14%), Dominican (14.3%, a difference of 0.58%), Immigrants from Dominican Republic (14.4%, a difference of 1.2%), Houma (14.6%, a difference of 2.5%), and Apache (14.7%, a difference of 3.4%).
| Demographics | Rating | Rank | Family Poverty |
| Menominee | 0.0 /100 | #323 | Tragic 12.7% |
| Immigrants | Dominica | 0.0 /100 | #324 | Tragic 12.7% |
| Paiute | 0.0 /100 | #325 | Tragic 13.0% |
| Colville | 0.0 /100 | #326 | Tragic 13.0% |
| Yakama | 0.0 /100 | #327 | Tragic 13.1% |
| Central American Indians | 0.0 /100 | #328 | Tragic 13.3% |
| Blacks/African Americans | 0.0 /100 | #329 | Tragic 13.3% |
| Natives/Alaskans | 0.0 /100 | #330 | Tragic 14.3% |
| Cheyenne | 0.0 /100 | #331 | Tragic 14.3% |
| Dominicans | 0.0 /100 | #332 | Tragic 14.3% |
| Immigrants | Dominican Republic | 0.0 /100 | #333 | Tragic 14.4% |
| Houma | 0.0 /100 | #334 | Tragic 14.6% |
| Apache | 0.0 /100 | #335 | Tragic 14.7% |
| Sioux | 0.0 /100 | #336 | Tragic 15.9% |
| Hopi | 0.0 /100 | #337 | Tragic 15.9% |