Immigrants from Costa Rica vs Hmong Family Poverty
COMPARE
Immigrants from Costa Rica
Hmong
Family Poverty
Family Poverty Comparison
Immigrants from Costa Rica
Hmong
9.4%
FAMILY POVERTY
21.7/ 100
METRIC RATING
200th/ 347
METRIC RANK
9.1%
FAMILY POVERTY
40.2/ 100
METRIC RATING
181st/ 347
METRIC RANK
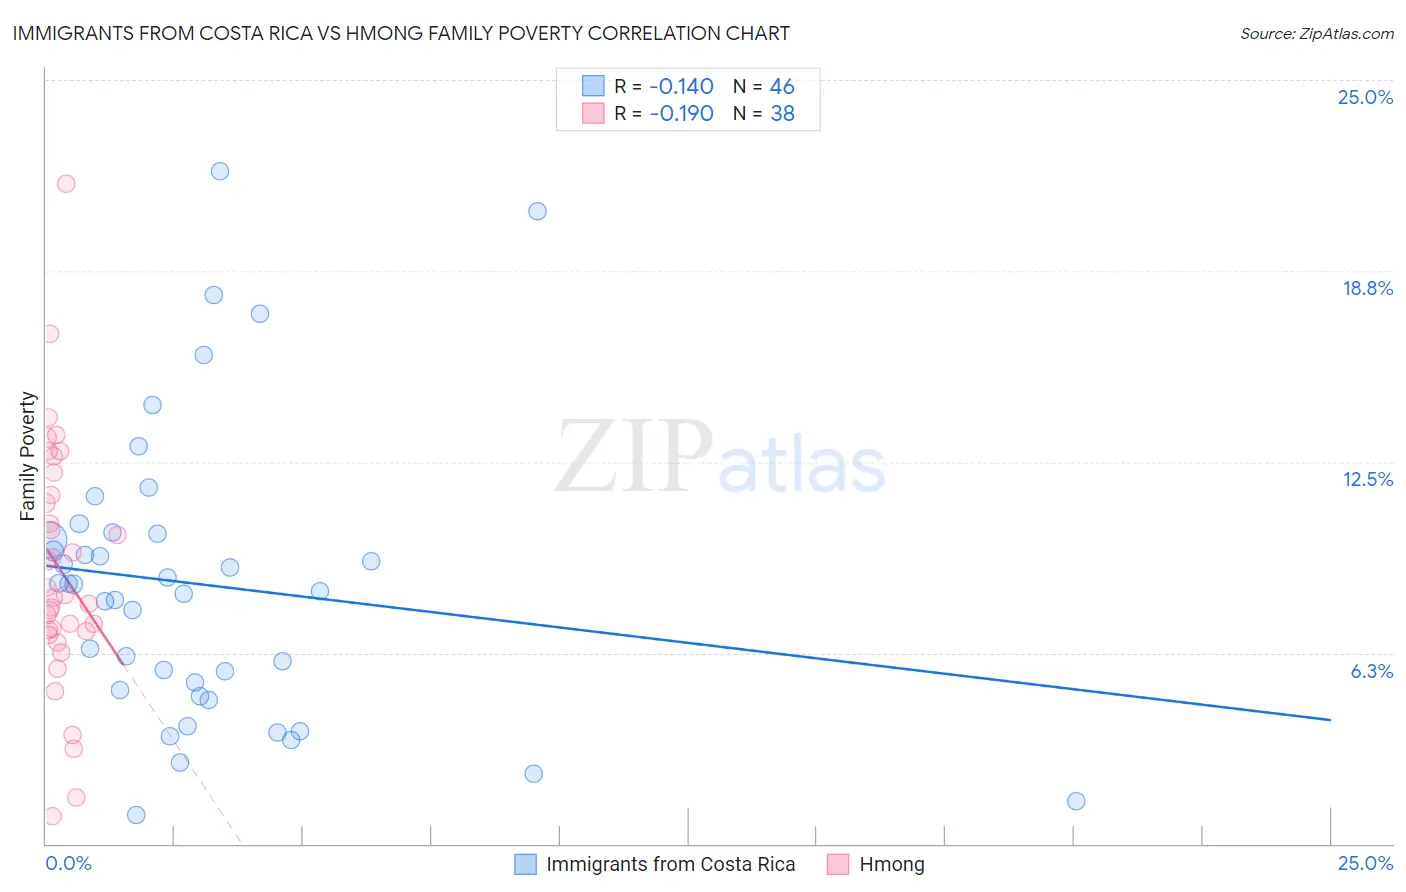
Immigrants from Costa Rica vs Hmong Family Poverty Correlation Chart
The statistical analysis conducted on geographies consisting of 204,115,485 people shows a poor negative correlation between the proportion of Immigrants from Costa Rica and poverty level among families in the United States with a correlation coefficient (R) of -0.140 and weighted average of 9.4%. Similarly, the statistical analysis conducted on geographies consisting of 24,669,739 people shows a poor negative correlation between the proportion of Hmong and poverty level among families in the United States with a correlation coefficient (R) of -0.190 and weighted average of 9.1%, a difference of 2.9%.
Family Poverty Correlation Summary
| Measurement | Immigrants from Costa Rica | Hmong |
| Minimum | 0.92% | 0.91% |
| Maximum | 22.0% | 21.6% |
| Range | 21.1% | 20.7% |
| Mean | 8.5% | 9.0% |
| Median | 8.4% | 8.1% |
| Interquartile 25% (IQ1) | 5.0% | 7.0% |
| Interquartile 75% (IQ3) | 10.2% | 11.4% |
| Interquartile Range (IQR) | 5.1% | 4.5% |
| Standard Deviation (Sample) | 4.8% | 4.1% |
| Standard Deviation (Population) | 4.7% | 4.0% |
Demographics Similar to Immigrants from Costa Rica and Hmong by Family Poverty
In terms of family poverty, the demographic groups most similar to Immigrants from Costa Rica are Spaniard (9.4%, a difference of 0.19%), Iraqi (9.3%, a difference of 0.44%), Immigrants from Colombia (9.3%, a difference of 0.47%), Immigrants from Venezuela (9.3%, a difference of 0.76%), and Venezuelan (9.3%, a difference of 0.97%). Similarly, the demographic groups most similar to Hmong are Immigrants from Morocco (9.1%, a difference of 0.010%), Uruguayan (9.1%, a difference of 0.14%), South American Indian (9.1%, a difference of 0.21%), Immigrants from Saudi Arabia (9.1%, a difference of 0.22%), and Immigrants from Uganda (9.1%, a difference of 0.43%).
| Demographics | Rating | Rank | Family Poverty |
| Immigrants | Uganda | 43.4 /100 | #180 | Average 9.1% |
| Hmong | 40.2 /100 | #181 | Average 9.1% |
| Immigrants | Morocco | 40.2 /100 | #182 | Average 9.1% |
| Uruguayans | 39.2 /100 | #183 | Fair 9.1% |
| South American Indians | 38.7 /100 | #184 | Fair 9.1% |
| Immigrants | Saudi Arabia | 38.6 /100 | #185 | Fair 9.1% |
| Colombians | 36.1 /100 | #186 | Fair 9.2% |
| Delaware | 35.4 /100 | #187 | Fair 9.2% |
| Immigrants | Kenya | 34.0 /100 | #188 | Fair 9.2% |
| Immigrants | Afghanistan | 32.1 /100 | #189 | Fair 9.2% |
| Arabs | 31.5 /100 | #190 | Fair 9.2% |
| Ugandans | 28.7 /100 | #191 | Fair 9.3% |
| Spanish | 28.7 /100 | #192 | Fair 9.3% |
| Immigrants | Western Asia | 28.2 /100 | #193 | Fair 9.3% |
| South Americans | 28.1 /100 | #194 | Fair 9.3% |
| Venezuelans | 27.4 /100 | #195 | Fair 9.3% |
| Immigrants | Venezuela | 26.1 /100 | #196 | Fair 9.3% |
| Immigrants | Colombia | 24.4 /100 | #197 | Fair 9.3% |
| Iraqis | 24.2 /100 | #198 | Fair 9.3% |
| Spaniards | 22.8 /100 | #199 | Fair 9.4% |
| Immigrants | Costa Rica | 21.7 /100 | #200 | Fair 9.4% |