Immigrants from Lithuania vs Ecuadorian Family Poverty
COMPARE
Immigrants from Lithuania
Ecuadorian
Family Poverty
Family Poverty Comparison
Immigrants from Lithuania
Ecuadorians
7.2%
FAMILY POVERTY
99.8/ 100
METRIC RATING
18th/ 347
METRIC RANK
10.8%
FAMILY POVERTY
0.2/ 100
METRIC RATING
254th/ 347
METRIC RANK
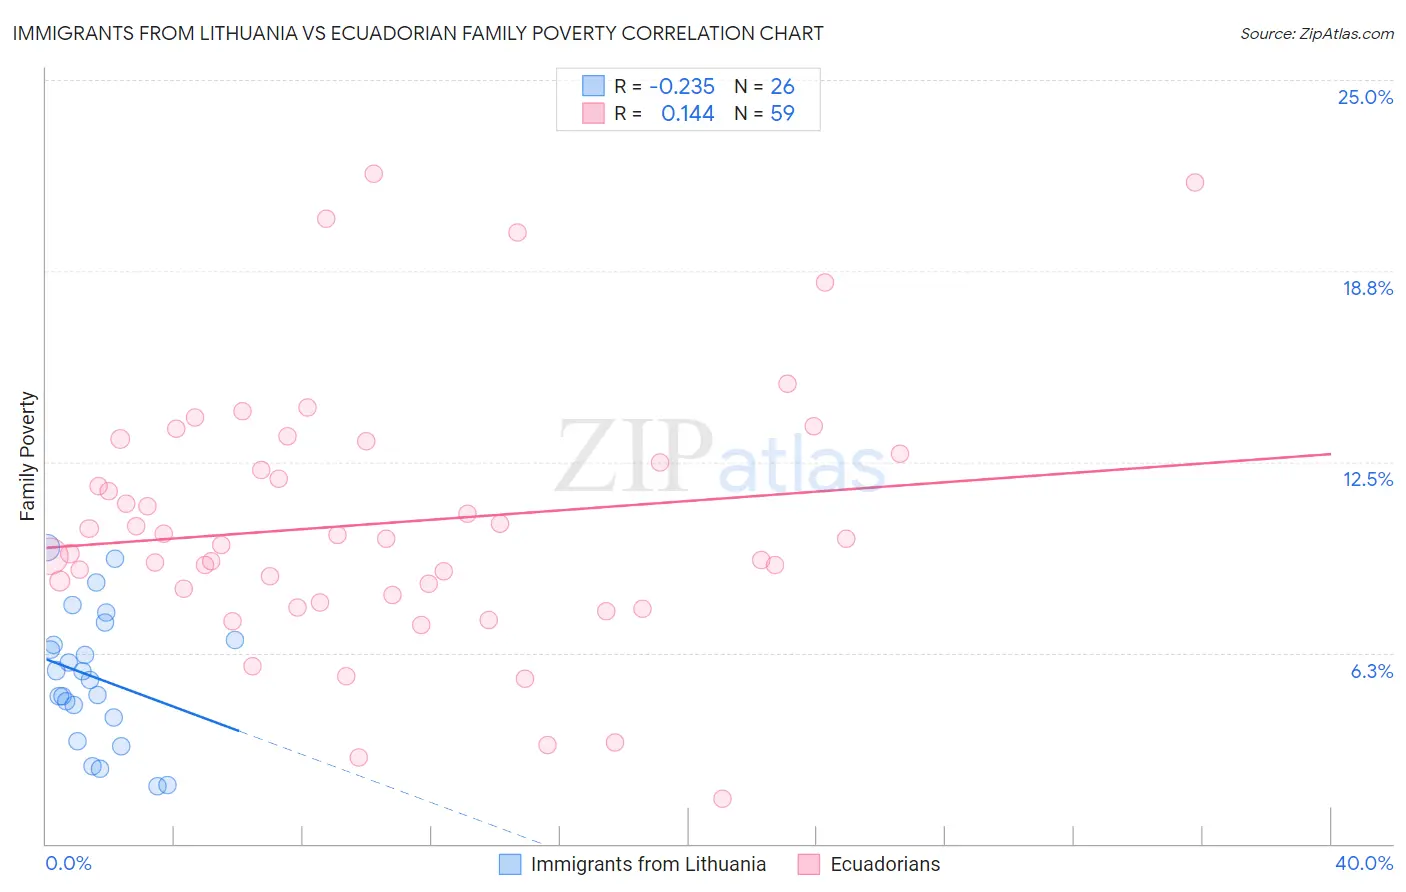
Immigrants from Lithuania vs Ecuadorian Family Poverty Correlation Chart
The statistical analysis conducted on geographies consisting of 117,605,958 people shows a weak negative correlation between the proportion of Immigrants from Lithuania and poverty level among families in the United States with a correlation coefficient (R) of -0.235 and weighted average of 7.2%. Similarly, the statistical analysis conducted on geographies consisting of 317,108,203 people shows a poor positive correlation between the proportion of Ecuadorians and poverty level among families in the United States with a correlation coefficient (R) of 0.144 and weighted average of 10.8%, a difference of 49.2%.
Family Poverty Correlation Summary
| Measurement | Immigrants from Lithuania | Ecuadorian |
| Minimum | 1.9% | 1.5% |
| Maximum | 9.7% | 21.9% |
| Range | 7.8% | 20.5% |
| Mean | 5.5% | 10.5% |
| Median | 5.5% | 10.0% |
| Interquartile 25% (IQ1) | 4.1% | 8.1% |
| Interquartile 75% (IQ3) | 6.7% | 12.8% |
| Interquartile Range (IQR) | 2.5% | 4.6% |
| Standard Deviation (Sample) | 2.2% | 4.2% |
| Standard Deviation (Population) | 2.1% | 4.2% |
Similar Demographics by Family Poverty
Demographics Similar to Immigrants from Lithuania by Family Poverty
In terms of family poverty, the demographic groups most similar to Immigrants from Lithuania are Luxembourger (7.2%, a difference of 0.010%), Immigrants from South Central Asia (7.2%, a difference of 0.24%), Eastern European (7.2%, a difference of 0.30%), Immigrants from Hong Kong (7.3%, a difference of 0.46%), and Lithuanian (7.2%, a difference of 0.51%).
| Demographics | Rating | Rank | Family Poverty |
| Immigrants | Singapore | 99.8 /100 | #11 | Exceptional 7.1% |
| Maltese | 99.8 /100 | #12 | Exceptional 7.1% |
| Swedes | 99.8 /100 | #13 | Exceptional 7.1% |
| Iranians | 99.8 /100 | #14 | Exceptional 7.1% |
| Lithuanians | 99.8 /100 | #15 | Exceptional 7.2% |
| Immigrants | South Central Asia | 99.8 /100 | #16 | Exceptional 7.2% |
| Luxembourgers | 99.8 /100 | #17 | Exceptional 7.2% |
| Immigrants | Lithuania | 99.8 /100 | #18 | Exceptional 7.2% |
| Eastern Europeans | 99.7 /100 | #19 | Exceptional 7.2% |
| Immigrants | Hong Kong | 99.7 /100 | #20 | Exceptional 7.3% |
| Immigrants | Iran | 99.7 /100 | #21 | Exceptional 7.3% |
| Danes | 99.7 /100 | #22 | Exceptional 7.3% |
| Assyrians/Chaldeans/Syriacs | 99.7 /100 | #23 | Exceptional 7.3% |
| Croatians | 99.7 /100 | #24 | Exceptional 7.3% |
| Burmese | 99.7 /100 | #25 | Exceptional 7.3% |
Demographics Similar to Ecuadorians by Family Poverty
In terms of family poverty, the demographic groups most similar to Ecuadorians are Immigrants from Western Africa (10.7%, a difference of 0.30%), Immigrants from Liberia (10.8%, a difference of 0.37%), Immigrants from Zaire (10.7%, a difference of 0.41%), Iroquois (10.7%, a difference of 0.53%), and Chickasaw (10.8%, a difference of 0.64%).
| Demographics | Rating | Rank | Family Poverty |
| Liberians | 0.4 /100 | #247 | Tragic 10.6% |
| Nicaraguans | 0.4 /100 | #248 | Tragic 10.6% |
| Cubans | 0.4 /100 | #249 | Tragic 10.6% |
| Salvadorans | 0.3 /100 | #250 | Tragic 10.7% |
| Iroquois | 0.3 /100 | #251 | Tragic 10.7% |
| Immigrants | Zaire | 0.3 /100 | #252 | Tragic 10.7% |
| Immigrants | Western Africa | 0.3 /100 | #253 | Tragic 10.7% |
| Ecuadorians | 0.2 /100 | #254 | Tragic 10.8% |
| Immigrants | Liberia | 0.2 /100 | #255 | Tragic 10.8% |
| Chickasaw | 0.2 /100 | #256 | Tragic 10.8% |
| Immigrants | Ghana | 0.2 /100 | #257 | Tragic 10.8% |
| Sub-Saharan Africans | 0.2 /100 | #258 | Tragic 10.9% |
| Mexican American Indians | 0.2 /100 | #259 | Tragic 10.9% |
| Bangladeshis | 0.2 /100 | #260 | Tragic 10.9% |
| Shoshone | 0.2 /100 | #261 | Tragic 10.9% |