Immigrants from Laos vs Immigrants from Belize Female Poverty Among 18-24 Year Olds
COMPARE
Immigrants from Laos
Immigrants from Belize
Female Poverty Among 18-24 Year Olds
Female Poverty Among 18-24 Year Olds Comparison
Immigrants from Laos
Immigrants from Belize
20.6%
FEMALE POVERTY AMONG 18-24 YEAR OLDS
9.7/ 100
METRIC RATING
217th/ 347
METRIC RANK
19.8%
FEMALE POVERTY AMONG 18-24 YEAR OLDS
74.1/ 100
METRIC RATING
161st/ 347
METRIC RANK
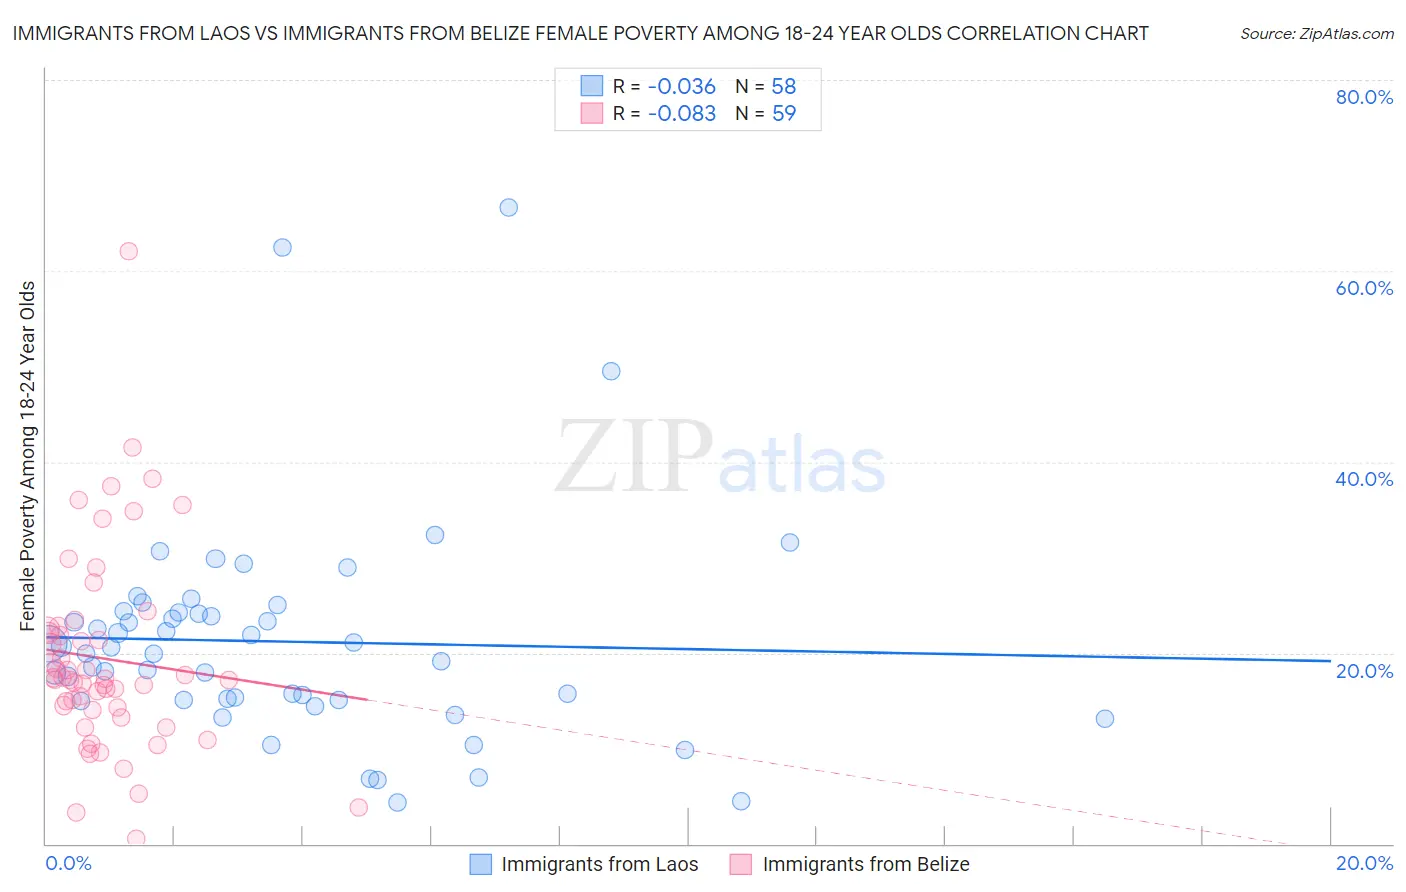
Immigrants from Laos vs Immigrants from Belize Female Poverty Among 18-24 Year Olds Correlation Chart
The statistical analysis conducted on geographies consisting of 199,404,827 people shows no correlation between the proportion of Immigrants from Laos and poverty level among females between the ages 18 and 24 in the United States with a correlation coefficient (R) of -0.036 and weighted average of 20.6%. Similarly, the statistical analysis conducted on geographies consisting of 129,541,689 people shows a slight negative correlation between the proportion of Immigrants from Belize and poverty level among females between the ages 18 and 24 in the United States with a correlation coefficient (R) of -0.083 and weighted average of 19.8%, a difference of 4.1%.
Female Poverty Among 18-24 Year Olds Correlation Summary
| Measurement | Immigrants from Laos | Immigrants from Belize |
| Minimum | 4.4% | 0.55% |
| Maximum | 66.7% | 62.1% |
| Range | 62.3% | 61.5% |
| Mean | 21.2% | 19.4% |
| Median | 20.2% | 17.2% |
| Interquartile 25% (IQ1) | 15.1% | 14.0% |
| Interquartile 75% (IQ3) | 24.2% | 22.4% |
| Interquartile Range (IQR) | 9.2% | 8.5% |
| Standard Deviation (Sample) | 11.4% | 10.5% |
| Standard Deviation (Population) | 11.3% | 10.4% |
Similar Demographics by Female Poverty Among 18-24 Year Olds
Demographics Similar to Immigrants from Laos by Female Poverty Among 18-24 Year Olds
In terms of female poverty among 18-24 year olds, the demographic groups most similar to Immigrants from Laos are Immigrants from Nepal (20.7%, a difference of 0.010%), Immigrants from Micronesia (20.7%, a difference of 0.020%), British (20.7%, a difference of 0.040%), Immigrants from Western Africa (20.6%, a difference of 0.070%), and Spanish (20.6%, a difference of 0.090%).
| Demographics | Rating | Rank | Female Poverty Among 18-24 Year Olds |
| Immigrants | Ghana | 14.3 /100 | #210 | Poor 20.5% |
| Immigrants | Western Europe | 13.5 /100 | #211 | Poor 20.6% |
| Liberians | 11.6 /100 | #212 | Poor 20.6% |
| Northern Europeans | 11.6 /100 | #213 | Poor 20.6% |
| Immigrants | South Africa | 10.7 /100 | #214 | Poor 20.6% |
| Spanish | 10.4 /100 | #215 | Poor 20.6% |
| Immigrants | Western Africa | 10.2 /100 | #216 | Poor 20.6% |
| Immigrants | Laos | 9.7 /100 | #217 | Tragic 20.6% |
| Immigrants | Nepal | 9.6 /100 | #218 | Tragic 20.7% |
| Immigrants | Micronesia | 9.6 /100 | #219 | Tragic 20.7% |
| British | 9.4 /100 | #220 | Tragic 20.7% |
| Barbadians | 9.0 /100 | #221 | Tragic 20.7% |
| Guatemalans | 8.1 /100 | #222 | Tragic 20.7% |
| French | 7.9 /100 | #223 | Tragic 20.7% |
| Immigrants | Liberia | 7.6 /100 | #224 | Tragic 20.7% |
Demographics Similar to Immigrants from Belize by Female Poverty Among 18-24 Year Olds
In terms of female poverty among 18-24 year olds, the demographic groups most similar to Immigrants from Belize are Pakistani (19.8%, a difference of 0.0%), Trinidadian and Tobagonian (19.8%, a difference of 0.020%), French Canadian (19.9%, a difference of 0.070%), Immigrants from Lebanon (19.8%, a difference of 0.080%), and Danish (19.8%, a difference of 0.090%).
| Demographics | Rating | Rank | Female Poverty Among 18-24 Year Olds |
| Immigrants | Zimbabwe | 76.7 /100 | #154 | Good 19.8% |
| Hungarians | 76.6 /100 | #155 | Good 19.8% |
| Immigrants | Belgium | 76.4 /100 | #156 | Good 19.8% |
| Danes | 75.5 /100 | #157 | Good 19.8% |
| Immigrants | Lebanon | 75.3 /100 | #158 | Good 19.8% |
| Trinidadians and Tobagonians | 74.4 /100 | #159 | Good 19.8% |
| Pakistanis | 74.1 /100 | #160 | Good 19.8% |
| Immigrants | Belize | 74.1 /100 | #161 | Good 19.8% |
| French Canadians | 73.0 /100 | #162 | Good 19.9% |
| Malaysians | 72.7 /100 | #163 | Good 19.9% |
| Central Americans | 70.0 /100 | #164 | Good 19.9% |
| Eastern Europeans | 69.3 /100 | #165 | Good 19.9% |
| Belgians | 69.1 /100 | #166 | Good 19.9% |
| Czechoslovakians | 61.8 /100 | #167 | Good 20.0% |
| Fijians | 59.1 /100 | #168 | Average 20.0% |