Immigrants from Laos vs Indian (Asian) Female Poverty Among 18-24 Year Olds
COMPARE
Immigrants from Laos
Indian (Asian)
Female Poverty Among 18-24 Year Olds
Female Poverty Among 18-24 Year Olds Comparison
Immigrants from Laos
Indians (Asian)
20.6%
FEMALE POVERTY AMONG 18-24 YEAR OLDS
9.7/ 100
METRIC RATING
217th/ 347
METRIC RANK
19.6%
FEMALE POVERTY AMONG 18-24 YEAR OLDS
88.3/ 100
METRIC RATING
139th/ 347
METRIC RANK
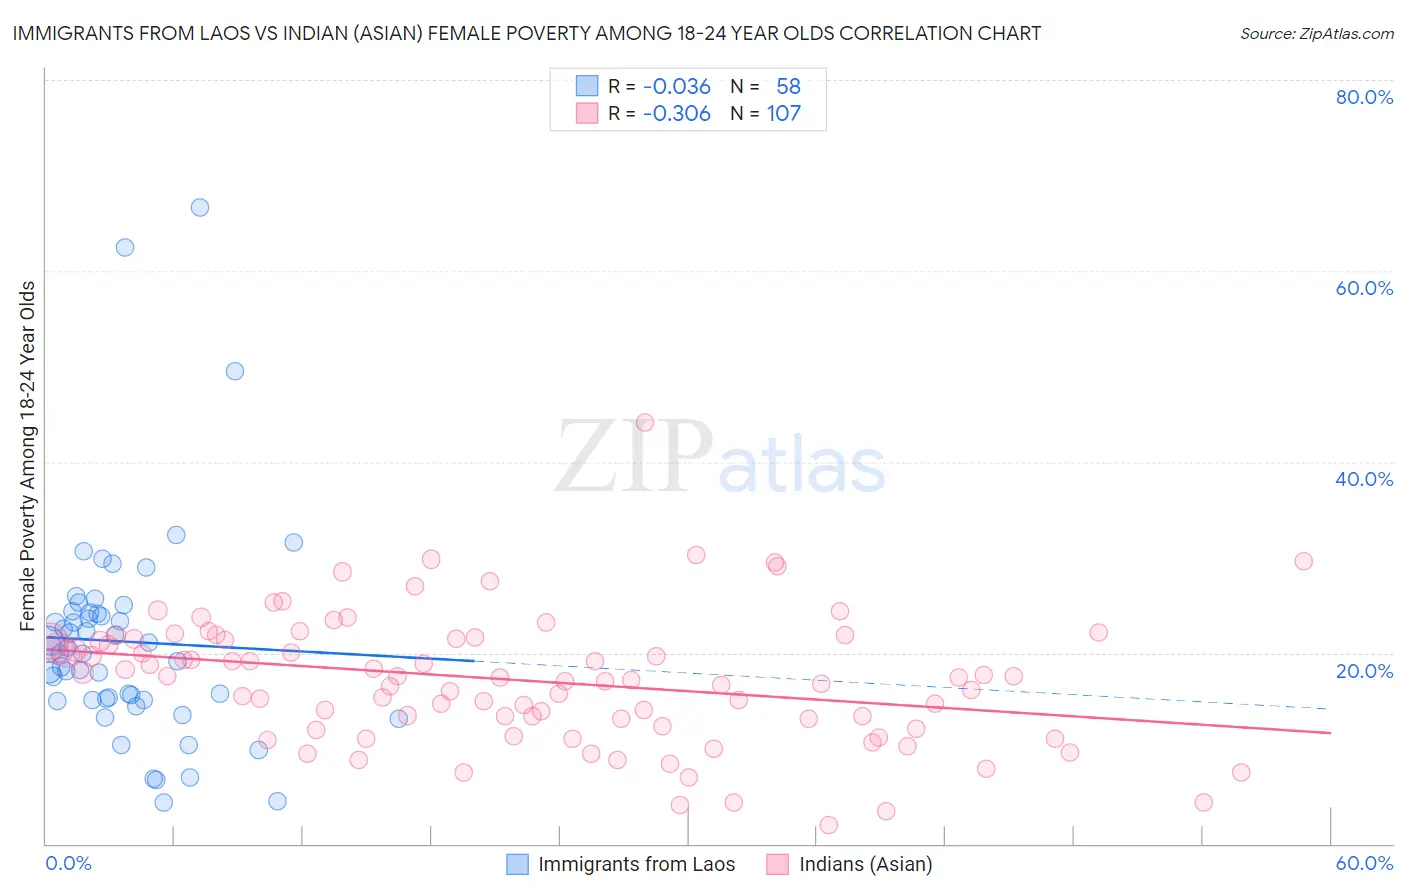
Immigrants from Laos vs Indian (Asian) Female Poverty Among 18-24 Year Olds Correlation Chart
The statistical analysis conducted on geographies consisting of 199,404,827 people shows no correlation between the proportion of Immigrants from Laos and poverty level among females between the ages 18 and 24 in the United States with a correlation coefficient (R) of -0.036 and weighted average of 20.6%. Similarly, the statistical analysis conducted on geographies consisting of 476,846,332 people shows a mild negative correlation between the proportion of Indians (Asian) and poverty level among females between the ages 18 and 24 in the United States with a correlation coefficient (R) of -0.306 and weighted average of 19.6%, a difference of 5.3%.
Female Poverty Among 18-24 Year Olds Correlation Summary
| Measurement | Immigrants from Laos | Indian (Asian) |
| Minimum | 4.4% | 2.0% |
| Maximum | 66.7% | 44.1% |
| Range | 62.3% | 42.1% |
| Mean | 21.2% | 17.1% |
| Median | 20.2% | 17.4% |
| Interquartile 25% (IQ1) | 15.1% | 12.3% |
| Interquartile 75% (IQ3) | 24.2% | 21.4% |
| Interquartile Range (IQR) | 9.2% | 9.1% |
| Standard Deviation (Sample) | 11.4% | 6.8% |
| Standard Deviation (Population) | 11.3% | 6.8% |
Similar Demographics by Female Poverty Among 18-24 Year Olds
Demographics Similar to Immigrants from Laos by Female Poverty Among 18-24 Year Olds
In terms of female poverty among 18-24 year olds, the demographic groups most similar to Immigrants from Laos are Immigrants from Nepal (20.7%, a difference of 0.010%), Immigrants from Micronesia (20.7%, a difference of 0.020%), British (20.7%, a difference of 0.040%), Immigrants from Western Africa (20.6%, a difference of 0.070%), and Spanish (20.6%, a difference of 0.090%).
| Demographics | Rating | Rank | Female Poverty Among 18-24 Year Olds |
| Immigrants | Ghana | 14.3 /100 | #210 | Poor 20.5% |
| Immigrants | Western Europe | 13.5 /100 | #211 | Poor 20.6% |
| Liberians | 11.6 /100 | #212 | Poor 20.6% |
| Northern Europeans | 11.6 /100 | #213 | Poor 20.6% |
| Immigrants | South Africa | 10.7 /100 | #214 | Poor 20.6% |
| Spanish | 10.4 /100 | #215 | Poor 20.6% |
| Immigrants | Western Africa | 10.2 /100 | #216 | Poor 20.6% |
| Immigrants | Laos | 9.7 /100 | #217 | Tragic 20.6% |
| Immigrants | Nepal | 9.6 /100 | #218 | Tragic 20.7% |
| Immigrants | Micronesia | 9.6 /100 | #219 | Tragic 20.7% |
| British | 9.4 /100 | #220 | Tragic 20.7% |
| Barbadians | 9.0 /100 | #221 | Tragic 20.7% |
| Guatemalans | 8.1 /100 | #222 | Tragic 20.7% |
| French | 7.9 /100 | #223 | Tragic 20.7% |
| Immigrants | Liberia | 7.6 /100 | #224 | Tragic 20.7% |
Demographics Similar to Indians (Asian) by Female Poverty Among 18-24 Year Olds
In terms of female poverty among 18-24 year olds, the demographic groups most similar to Indians (Asian) are Immigrants from Morocco (19.6%, a difference of 0.20%), Immigrants from Trinidad and Tobago (19.7%, a difference of 0.30%), Pennsylvania German (19.7%, a difference of 0.31%), Austrian (19.5%, a difference of 0.32%), and Panamanian (19.7%, a difference of 0.41%).
| Demographics | Rating | Rank | Female Poverty Among 18-24 Year Olds |
| Jamaicans | 92.1 /100 | #132 | Exceptional 19.5% |
| Turks | 92.1 /100 | #133 | Exceptional 19.5% |
| Immigrants | North America | 92.1 /100 | #134 | Exceptional 19.5% |
| Soviet Union | 92.0 /100 | #135 | Exceptional 19.5% |
| Russians | 91.5 /100 | #136 | Exceptional 19.5% |
| Austrians | 90.7 /100 | #137 | Exceptional 19.5% |
| Immigrants | Morocco | 89.9 /100 | #138 | Excellent 19.6% |
| Indians (Asian) | 88.3 /100 | #139 | Excellent 19.6% |
| Immigrants | Trinidad and Tobago | 85.6 /100 | #140 | Excellent 19.7% |
| Pennsylvania Germans | 85.5 /100 | #141 | Excellent 19.7% |
| Panamanians | 84.6 /100 | #142 | Excellent 19.7% |
| Slavs | 84.4 /100 | #143 | Excellent 19.7% |
| Immigrants | Northern Africa | 84.1 /100 | #144 | Excellent 19.7% |
| Canadians | 83.8 /100 | #145 | Excellent 19.7% |
| Immigrants | Bosnia and Herzegovina | 83.6 /100 | #146 | Excellent 19.7% |