Immigrants from Italy vs Ukrainian Receiving Food Stamps
COMPARE
Immigrants from Italy
Ukrainian
Receiving Food Stamps
Receiving Food Stamps Comparison
Immigrants from Italy
Ukrainians
10.4%
RECEIVING FOOD STAMPS
96.4/ 100
METRIC RATING
106th/ 347
METRIC RANK
10.7%
RECEIVING FOOD STAMPS
92.8/ 100
METRIC RATING
125th/ 347
METRIC RANK
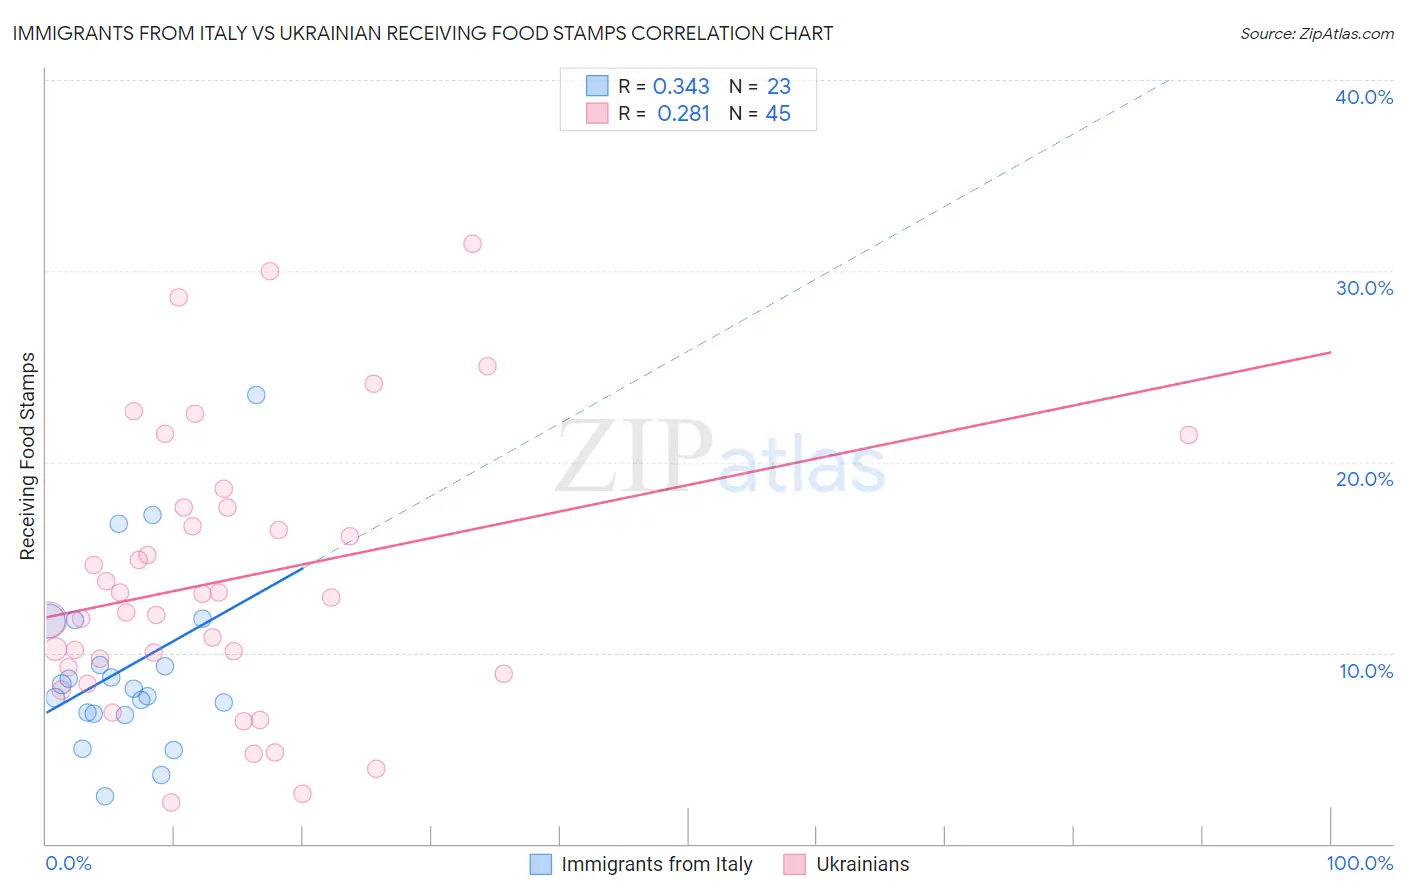
Immigrants from Italy vs Ukrainian Receiving Food Stamps Correlation Chart
The statistical analysis conducted on geographies consisting of 323,254,250 people shows a mild positive correlation between the proportion of Immigrants from Italy and percentage of population receiving government assistance and/or food stamps in the United States with a correlation coefficient (R) of 0.343 and weighted average of 10.4%. Similarly, the statistical analysis conducted on geographies consisting of 446,698,420 people shows a weak positive correlation between the proportion of Ukrainians and percentage of population receiving government assistance and/or food stamps in the United States with a correlation coefficient (R) of 0.281 and weighted average of 10.7%, a difference of 2.9%.
Receiving Food Stamps Correlation Summary
| Measurement | Immigrants from Italy | Ukrainian |
| Minimum | 2.5% | 2.2% |
| Maximum | 23.5% | 31.4% |
| Range | 21.0% | 29.2% |
| Mean | 9.2% | 13.8% |
| Median | 8.1% | 12.9% |
| Interquartile 25% (IQ1) | 6.8% | 9.1% |
| Interquartile 75% (IQ3) | 11.7% | 17.6% |
| Interquartile Range (IQR) | 4.9% | 8.5% |
| Standard Deviation (Sample) | 4.7% | 7.2% |
| Standard Deviation (Population) | 4.6% | 7.1% |
Demographics Similar to Immigrants from Italy and Ukrainians by Receiving Food Stamps
In terms of receiving food stamps, the demographic groups most similar to Immigrants from Italy are Immigrants from Malaysia (10.4%, a difference of 0.090%), Korean (10.4%, a difference of 0.15%), Carpatho Rusyn (10.4%, a difference of 0.19%), Immigrants from Pakistan (10.4%, a difference of 0.23%), and Pakistani (10.4%, a difference of 0.51%). Similarly, the demographic groups most similar to Ukrainians are Paraguayan (10.7%, a difference of 0.080%), Immigrants from Philippines (10.7%, a difference of 0.29%), Sri Lankan (10.6%, a difference of 0.55%), Slavic (10.6%, a difference of 0.62%), and Ethiopian (10.6%, a difference of 0.65%).
| Demographics | Rating | Rank | Receiving Food Stamps |
| Immigrants | Malaysia | 96.5 /100 | #105 | Exceptional 10.4% |
| Immigrants | Italy | 96.4 /100 | #106 | Exceptional 10.4% |
| Koreans | 96.3 /100 | #107 | Exceptional 10.4% |
| Carpatho Rusyns | 96.2 /100 | #108 | Exceptional 10.4% |
| Immigrants | Pakistan | 96.2 /100 | #109 | Exceptional 10.4% |
| Pakistanis | 95.9 /100 | #110 | Exceptional 10.4% |
| Romanians | 95.8 /100 | #111 | Exceptional 10.4% |
| Mongolians | 95.8 /100 | #112 | Exceptional 10.5% |
| Icelanders | 95.4 /100 | #113 | Exceptional 10.5% |
| Scotch-Irish | 95.1 /100 | #114 | Exceptional 10.5% |
| Immigrants | Saudi Arabia | 94.9 /100 | #115 | Exceptional 10.5% |
| Canadians | 94.8 /100 | #116 | Exceptional 10.5% |
| Immigrants | Nepal | 94.6 /100 | #117 | Exceptional 10.6% |
| Assyrians/Chaldeans/Syriacs | 94.1 /100 | #118 | Exceptional 10.6% |
| Immigrants | Poland | 93.9 /100 | #119 | Exceptional 10.6% |
| Ethiopians | 93.9 /100 | #120 | Exceptional 10.6% |
| Slavs | 93.8 /100 | #121 | Exceptional 10.6% |
| Sri Lankans | 93.7 /100 | #122 | Exceptional 10.6% |
| Immigrants | Philippines | 93.3 /100 | #123 | Exceptional 10.7% |
| Paraguayans | 93.0 /100 | #124 | Exceptional 10.7% |
| Ukrainians | 92.8 /100 | #125 | Exceptional 10.7% |