Immigrants from Italy vs Immigrants from Fiji Receiving Food Stamps
COMPARE
Immigrants from Italy
Immigrants from Fiji
Receiving Food Stamps
Receiving Food Stamps Comparison
Immigrants from Italy
Immigrants from Fiji
10.4%
RECEIVING FOOD STAMPS
96.4/ 100
METRIC RATING
106th/ 347
METRIC RANK
12.1%
RECEIVING FOOD STAMPS
27.8/ 100
METRIC RATING
193rd/ 347
METRIC RANK
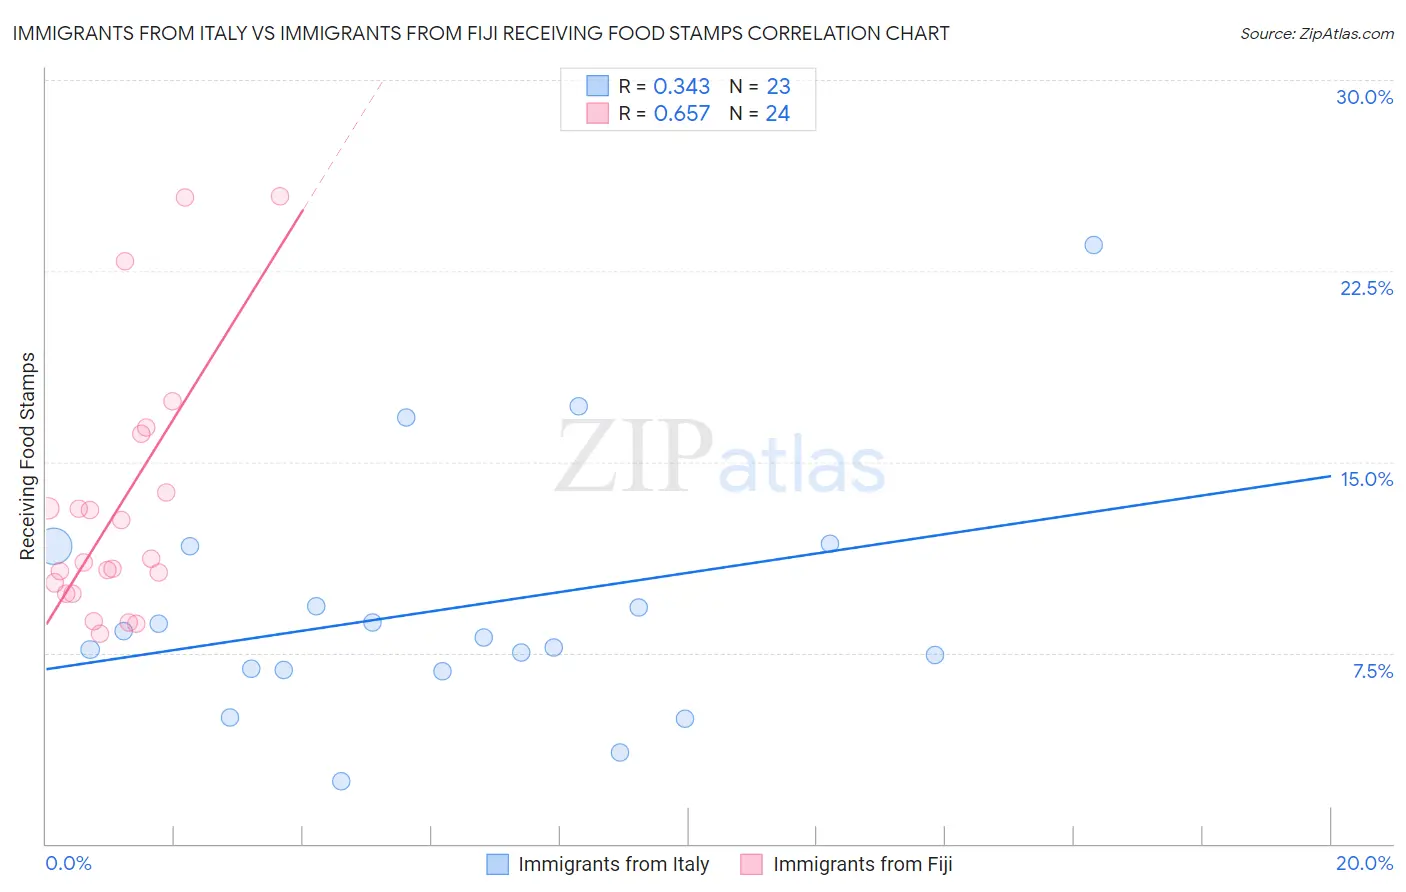
Immigrants from Italy vs Immigrants from Fiji Receiving Food Stamps Correlation Chart
The statistical analysis conducted on geographies consisting of 323,254,250 people shows a mild positive correlation between the proportion of Immigrants from Italy and percentage of population receiving government assistance and/or food stamps in the United States with a correlation coefficient (R) of 0.343 and weighted average of 10.4%. Similarly, the statistical analysis conducted on geographies consisting of 93,752,896 people shows a significant positive correlation between the proportion of Immigrants from Fiji and percentage of population receiving government assistance and/or food stamps in the United States with a correlation coefficient (R) of 0.657 and weighted average of 12.1%, a difference of 16.8%.
Receiving Food Stamps Correlation Summary
| Measurement | Immigrants from Italy | Immigrants from Fiji |
| Minimum | 2.5% | 8.3% |
| Maximum | 23.5% | 25.4% |
| Range | 21.0% | 17.2% |
| Mean | 9.2% | 13.3% |
| Median | 8.1% | 11.1% |
| Interquartile 25% (IQ1) | 6.8% | 10.0% |
| Interquartile 75% (IQ3) | 11.7% | 14.9% |
| Interquartile Range (IQR) | 4.9% | 4.9% |
| Standard Deviation (Sample) | 4.7% | 5.0% |
| Standard Deviation (Population) | 4.6% | 4.9% |
Similar Demographics by Receiving Food Stamps
Demographics Similar to Immigrants from Italy by Receiving Food Stamps
In terms of receiving food stamps, the demographic groups most similar to Immigrants from Italy are Immigrants from Malaysia (10.4%, a difference of 0.090%), Korean (10.4%, a difference of 0.15%), Carpatho Rusyn (10.4%, a difference of 0.19%), Immigrants from Pakistan (10.4%, a difference of 0.23%), and Immigrants from Hungary (10.3%, a difference of 0.41%).
| Demographics | Rating | Rank | Receiving Food Stamps |
| Serbians | 97.0 /100 | #99 | Exceptional 10.3% |
| Immigrants | Western Europe | 96.9 /100 | #100 | Exceptional 10.3% |
| Palestinians | 96.9 /100 | #101 | Exceptional 10.3% |
| Immigrants | Europe | 96.8 /100 | #102 | Exceptional 10.3% |
| Immigrants | Latvia | 96.8 /100 | #103 | Exceptional 10.3% |
| Immigrants | Hungary | 96.7 /100 | #104 | Exceptional 10.3% |
| Immigrants | Malaysia | 96.5 /100 | #105 | Exceptional 10.4% |
| Immigrants | Italy | 96.4 /100 | #106 | Exceptional 10.4% |
| Koreans | 96.3 /100 | #107 | Exceptional 10.4% |
| Carpatho Rusyns | 96.2 /100 | #108 | Exceptional 10.4% |
| Immigrants | Pakistan | 96.2 /100 | #109 | Exceptional 10.4% |
| Pakistanis | 95.9 /100 | #110 | Exceptional 10.4% |
| Romanians | 95.8 /100 | #111 | Exceptional 10.4% |
| Mongolians | 95.8 /100 | #112 | Exceptional 10.5% |
| Icelanders | 95.4 /100 | #113 | Exceptional 10.5% |
Demographics Similar to Immigrants from Fiji by Receiving Food Stamps
In terms of receiving food stamps, the demographic groups most similar to Immigrants from Fiji are Immigrants from Sudan (12.1%, a difference of 0.12%), American (12.2%, a difference of 0.18%), Iraqi (12.2%, a difference of 0.21%), Delaware (12.2%, a difference of 0.28%), and Immigrants from Costa Rica (12.2%, a difference of 0.42%).
| Demographics | Rating | Rank | Receiving Food Stamps |
| Spanish | 36.9 /100 | #186 | Fair 12.0% |
| Albanians | 35.4 /100 | #187 | Fair 12.0% |
| Sudanese | 33.4 /100 | #188 | Fair 12.0% |
| Immigrants | Cameroon | 32.5 /100 | #189 | Fair 12.0% |
| Immigrants | Peru | 32.2 /100 | #190 | Fair 12.0% |
| Venezuelans | 32.1 /100 | #191 | Fair 12.0% |
| Samoans | 31.0 /100 | #192 | Fair 12.1% |
| Immigrants | Fiji | 27.8 /100 | #193 | Fair 12.1% |
| Immigrants | Sudan | 27.1 /100 | #194 | Fair 12.1% |
| Americans | 26.7 /100 | #195 | Fair 12.2% |
| Iraqis | 26.6 /100 | #196 | Fair 12.2% |
| Delaware | 26.1 /100 | #197 | Fair 12.2% |
| Immigrants | Costa Rica | 25.4 /100 | #198 | Fair 12.2% |
| Portuguese | 25.1 /100 | #199 | Fair 12.2% |
| Sierra Leoneans | 23.6 /100 | #200 | Fair 12.2% |