Immigrants from Italy vs Ukrainian College, 1 year or more
COMPARE
Immigrants from Italy
Ukrainian
College, 1 year or more
College, 1 year or more Comparison
Immigrants from Italy
Ukrainians
61.2%
COLLEGE, 1 YEAR OR MORE
91.1/ 100
METRIC RATING
128th/ 347
METRIC RANK
61.8%
COLLEGE, 1 YEAR OR MORE
95.2/ 100
METRIC RATING
113th/ 347
METRIC RANK
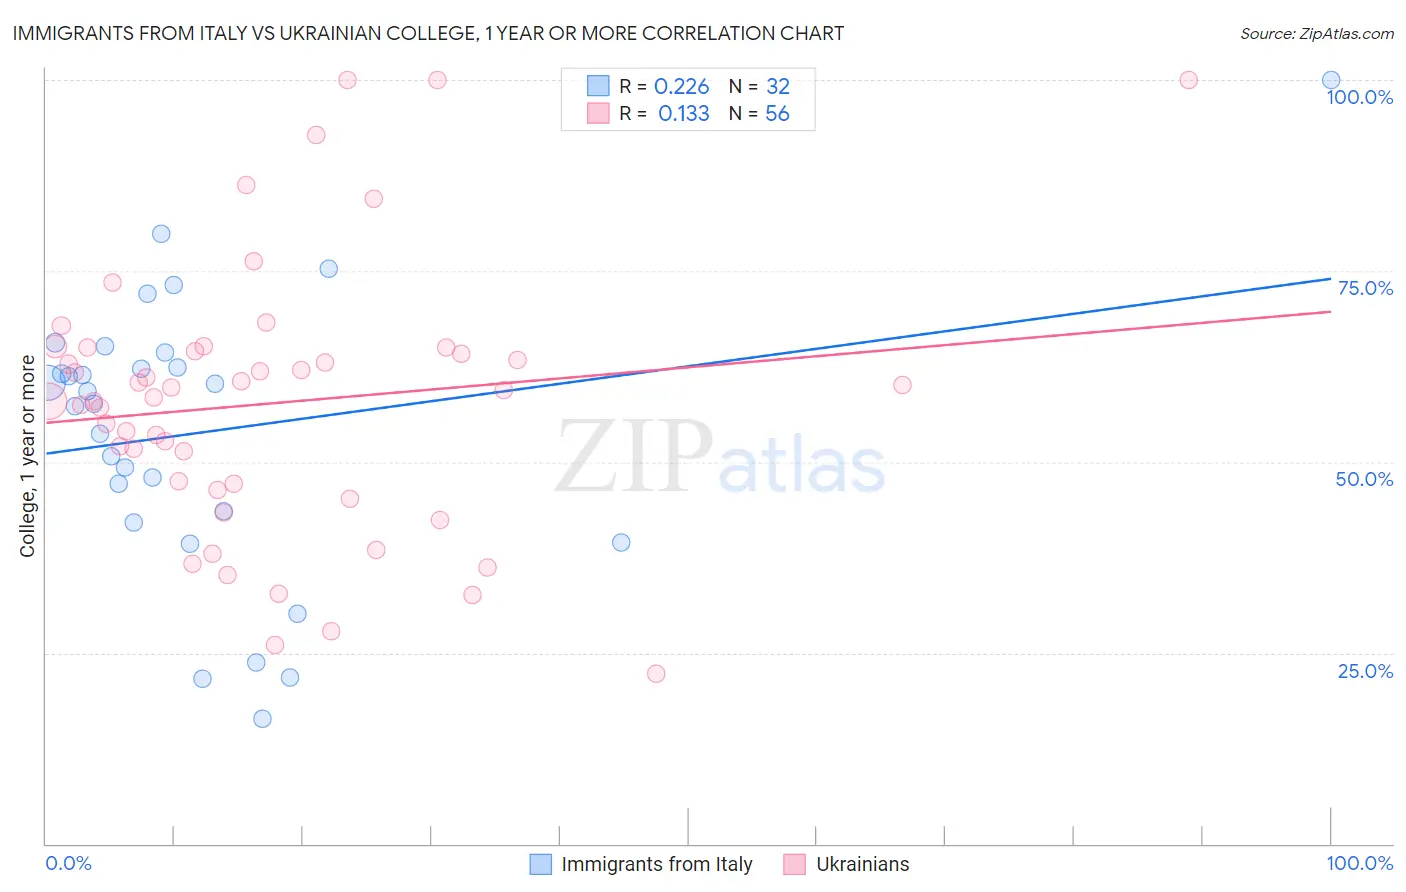
Immigrants from Italy vs Ukrainian College, 1 year or more Correlation Chart
The statistical analysis conducted on geographies consisting of 324,223,988 people shows a weak positive correlation between the proportion of Immigrants from Italy and percentage of population with at least college, 1 year or more education in the United States with a correlation coefficient (R) of 0.226 and weighted average of 61.2%. Similarly, the statistical analysis conducted on geographies consisting of 448,693,874 people shows a poor positive correlation between the proportion of Ukrainians and percentage of population with at least college, 1 year or more education in the United States with a correlation coefficient (R) of 0.133 and weighted average of 61.8%, a difference of 0.85%.
College, 1 year or more Correlation Summary
| Measurement | Immigrants from Italy | Ukrainian |
| Minimum | 16.4% | 22.2% |
| Maximum | 100.0% | 100.0% |
| Range | 83.6% | 77.8% |
| Mean | 53.9% | 57.7% |
| Median | 58.4% | 58.9% |
| Interquartile 25% (IQ1) | 42.8% | 46.7% |
| Interquartile 75% (IQ3) | 63.3% | 64.7% |
| Interquartile Range (IQR) | 20.4% | 17.9% |
| Standard Deviation (Sample) | 18.4% | 17.6% |
| Standard Deviation (Population) | 18.1% | 17.5% |
Demographics Similar to Immigrants from Italy and Ukrainians by College, 1 year or more
In terms of college, 1 year or more, the demographic groups most similar to Immigrants from Italy are Immigrants from Eastern Africa (61.2%, a difference of 0.0%), Alsatian (61.3%, a difference of 0.030%), Ugandan (61.2%, a difference of 0.060%), Immigrants from Syria (61.3%, a difference of 0.080%), and Venezuelan (61.3%, a difference of 0.16%). Similarly, the demographic groups most similar to Ukrainians are Austrian (61.8%, a difference of 0.070%), Danish (61.7%, a difference of 0.11%), European (61.8%, a difference of 0.13%), Macedonian (61.8%, a difference of 0.13%), and Norwegian (61.7%, a difference of 0.18%).
| Demographics | Rating | Rank | College, 1 year or more |
| Europeans | 95.6 /100 | #110 | Exceptional 61.8% |
| Macedonians | 95.6 /100 | #111 | Exceptional 61.8% |
| Austrians | 95.4 /100 | #112 | Exceptional 61.8% |
| Ukrainians | 95.2 /100 | #113 | Exceptional 61.8% |
| Danes | 94.8 /100 | #114 | Exceptional 61.7% |
| Norwegians | 94.5 /100 | #115 | Exceptional 61.7% |
| Lebanese | 94.1 /100 | #116 | Exceptional 61.6% |
| Arabs | 93.9 /100 | #117 | Exceptional 61.6% |
| Immigrants | Brazil | 93.9 /100 | #118 | Exceptional 61.6% |
| Assyrians/Chaldeans/Syriacs | 93.3 /100 | #119 | Exceptional 61.5% |
| Pakistanis | 93.2 /100 | #120 | Exceptional 61.5% |
| Immigrants | Jordan | 92.7 /100 | #121 | Exceptional 61.4% |
| Immigrants | Chile | 92.3 /100 | #122 | Exceptional 61.4% |
| Serbians | 92.2 /100 | #123 | Exceptional 61.4% |
| Venezuelans | 92.1 /100 | #124 | Exceptional 61.3% |
| Immigrants | Syria | 91.6 /100 | #125 | Exceptional 61.3% |
| Alsatians | 91.3 /100 | #126 | Exceptional 61.3% |
| Immigrants | Eastern Africa | 91.1 /100 | #127 | Exceptional 61.2% |
| Immigrants | Italy | 91.1 /100 | #128 | Exceptional 61.2% |
| Ugandans | 90.7 /100 | #129 | Exceptional 61.2% |
| Italians | 89.5 /100 | #130 | Excellent 61.1% |