Immigrants from Iraq vs South African Female Poverty
COMPARE
Immigrants from Iraq
South African
Female Poverty
Female Poverty Comparison
Immigrants from Iraq
South Africans
13.4%
FEMALE POVERTY
50.0/ 100
METRIC RATING
174th/ 347
METRIC RANK
12.8%
FEMALE POVERTY
88.4/ 100
METRIC RATING
127th/ 347
METRIC RANK
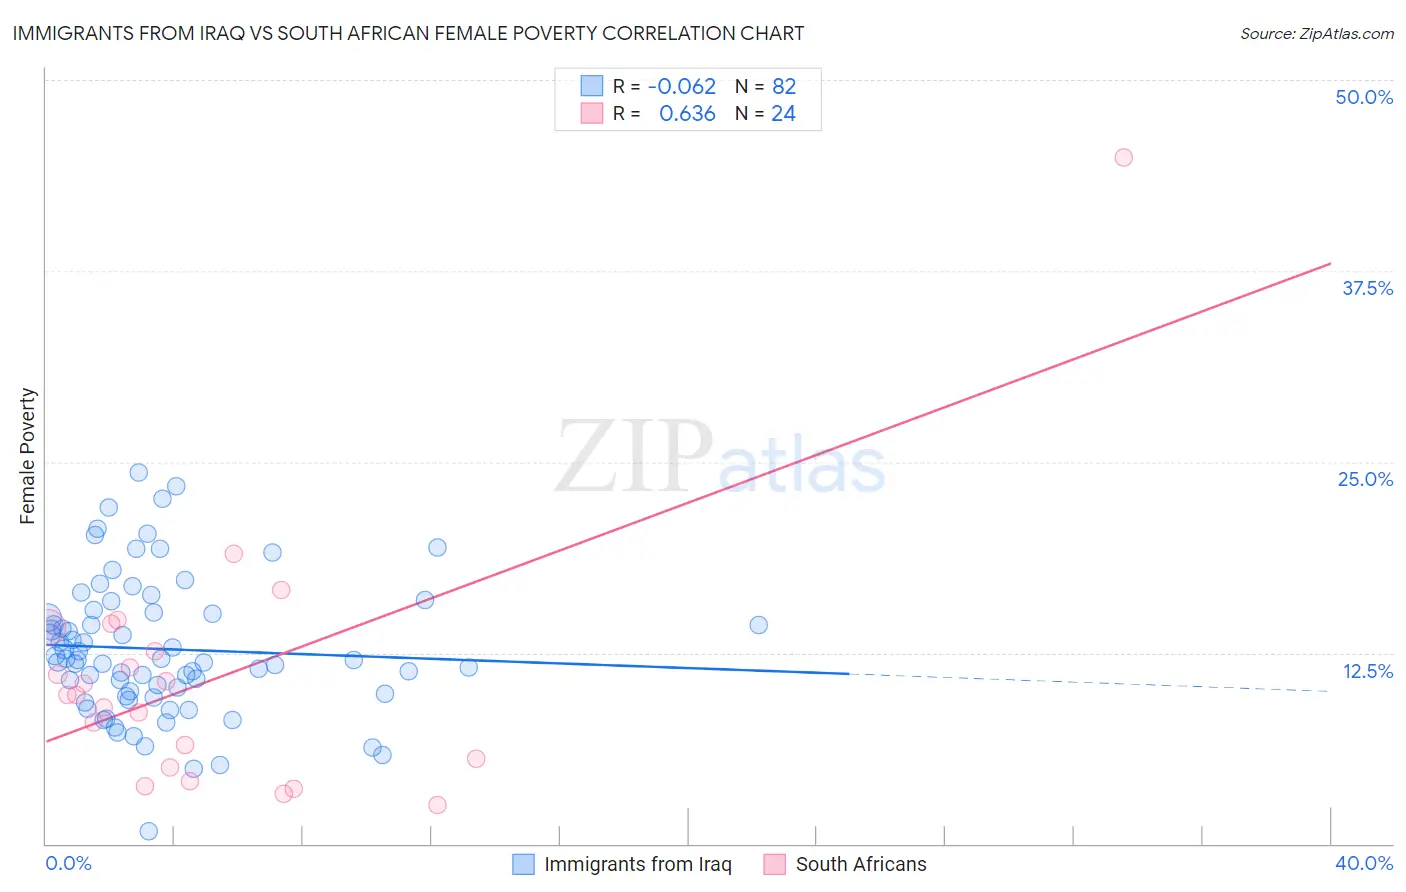
Immigrants from Iraq vs South African Female Poverty Correlation Chart
The statistical analysis conducted on geographies consisting of 194,711,025 people shows a slight negative correlation between the proportion of Immigrants from Iraq and poverty level among females in the United States with a correlation coefficient (R) of -0.062 and weighted average of 13.4%. Similarly, the statistical analysis conducted on geographies consisting of 182,540,648 people shows a significant positive correlation between the proportion of South Africans and poverty level among females in the United States with a correlation coefficient (R) of 0.636 and weighted average of 12.8%, a difference of 5.1%.
Female Poverty Correlation Summary
| Measurement | Immigrants from Iraq | South African |
| Minimum | 0.80% | 2.6% |
| Maximum | 24.3% | 44.9% |
| Range | 23.5% | 42.4% |
| Mean | 12.7% | 10.8% |
| Median | 12.1% | 9.7% |
| Interquartile 25% (IQ1) | 9.8% | 5.3% |
| Interquartile 75% (IQ3) | 15.1% | 13.4% |
| Interquartile Range (IQR) | 5.3% | 8.1% |
| Standard Deviation (Sample) | 4.5% | 8.5% |
| Standard Deviation (Population) | 4.5% | 8.4% |
Similar Demographics by Female Poverty
Demographics Similar to Immigrants from Iraq by Female Poverty
In terms of female poverty, the demographic groups most similar to Immigrants from Iraq are Celtic (13.4%, a difference of 0.010%), Immigrants from Spain (13.4%, a difference of 0.010%), Immigrants from Morocco (13.4%, a difference of 0.060%), Immigrants from Afghanistan (13.4%, a difference of 0.070%), and Israeli (13.5%, a difference of 0.090%).
| Demographics | Rating | Rank | Female Poverty |
| Immigrants | Chile | 57.4 /100 | #167 | Average 13.3% |
| Aleuts | 56.7 /100 | #168 | Average 13.4% |
| Lebanese | 55.9 /100 | #169 | Average 13.4% |
| Colombians | 55.7 /100 | #170 | Average 13.4% |
| Whites/Caucasians | 54.6 /100 | #171 | Average 13.4% |
| Mongolians | 53.6 /100 | #172 | Average 13.4% |
| Immigrants | Afghanistan | 50.8 /100 | #173 | Average 13.4% |
| Immigrants | Iraq | 50.0 /100 | #174 | Average 13.4% |
| Celtics | 49.9 /100 | #175 | Average 13.4% |
| Immigrants | Spain | 49.9 /100 | #176 | Average 13.4% |
| Immigrants | Morocco | 49.4 /100 | #177 | Average 13.4% |
| Israelis | 49.1 /100 | #178 | Average 13.5% |
| Immigrants | Syria | 48.8 /100 | #179 | Average 13.5% |
| South Americans | 44.8 /100 | #180 | Average 13.5% |
| Venezuelans | 44.5 /100 | #181 | Average 13.5% |
Demographics Similar to South Africans by Female Poverty
In terms of female poverty, the demographic groups most similar to South Africans are Immigrants from Belarus (12.8%, a difference of 0.040%), Immigrants from Ukraine (12.8%, a difference of 0.11%), Immigrants from Brazil (12.8%, a difference of 0.11%), Argentinean (12.8%, a difference of 0.18%), and Immigrants from Norway (12.8%, a difference of 0.23%).
| Demographics | Rating | Rank | Female Poverty |
| New Zealanders | 90.6 /100 | #120 | Exceptional 12.7% |
| Immigrants | Hungary | 90.3 /100 | #121 | Exceptional 12.7% |
| French Canadians | 90.2 /100 | #122 | Exceptional 12.7% |
| Immigrants | South Eastern Asia | 89.9 /100 | #123 | Excellent 12.7% |
| Immigrants | Norway | 89.3 /100 | #124 | Excellent 12.8% |
| Argentineans | 89.1 /100 | #125 | Excellent 12.8% |
| Immigrants | Ukraine | 88.8 /100 | #126 | Excellent 12.8% |
| South Africans | 88.4 /100 | #127 | Excellent 12.8% |
| Immigrants | Belarus | 88.2 /100 | #128 | Excellent 12.8% |
| Immigrants | Brazil | 87.9 /100 | #129 | Excellent 12.8% |
| Immigrants | Vietnam | 87.1 /100 | #130 | Excellent 12.8% |
| Immigrants | Argentina | 87.0 /100 | #131 | Excellent 12.8% |
| Immigrants | Jordan | 86.9 /100 | #132 | Excellent 12.8% |
| Immigrants | Western Europe | 86.6 /100 | #133 | Excellent 12.8% |
| Immigrants | Switzerland | 85.8 /100 | #134 | Excellent 12.9% |