Immigrants from Hong Kong vs Somali Female Poverty Among 25-34 Year Olds
COMPARE
Immigrants from Hong Kong
Somali
Female Poverty Among 25-34 Year Olds
Female Poverty Among 25-34 Year Olds Comparison
Immigrants from Hong Kong
Somalis
10.4%
FEMALE POVERTY AMONG 25-34 YEAR OLDS
100.0/ 100
METRIC RATING
5th/ 347
METRIC RANK
15.1%
FEMALE POVERTY AMONG 25-34 YEAR OLDS
0.4/ 100
METRIC RATING
254th/ 347
METRIC RANK
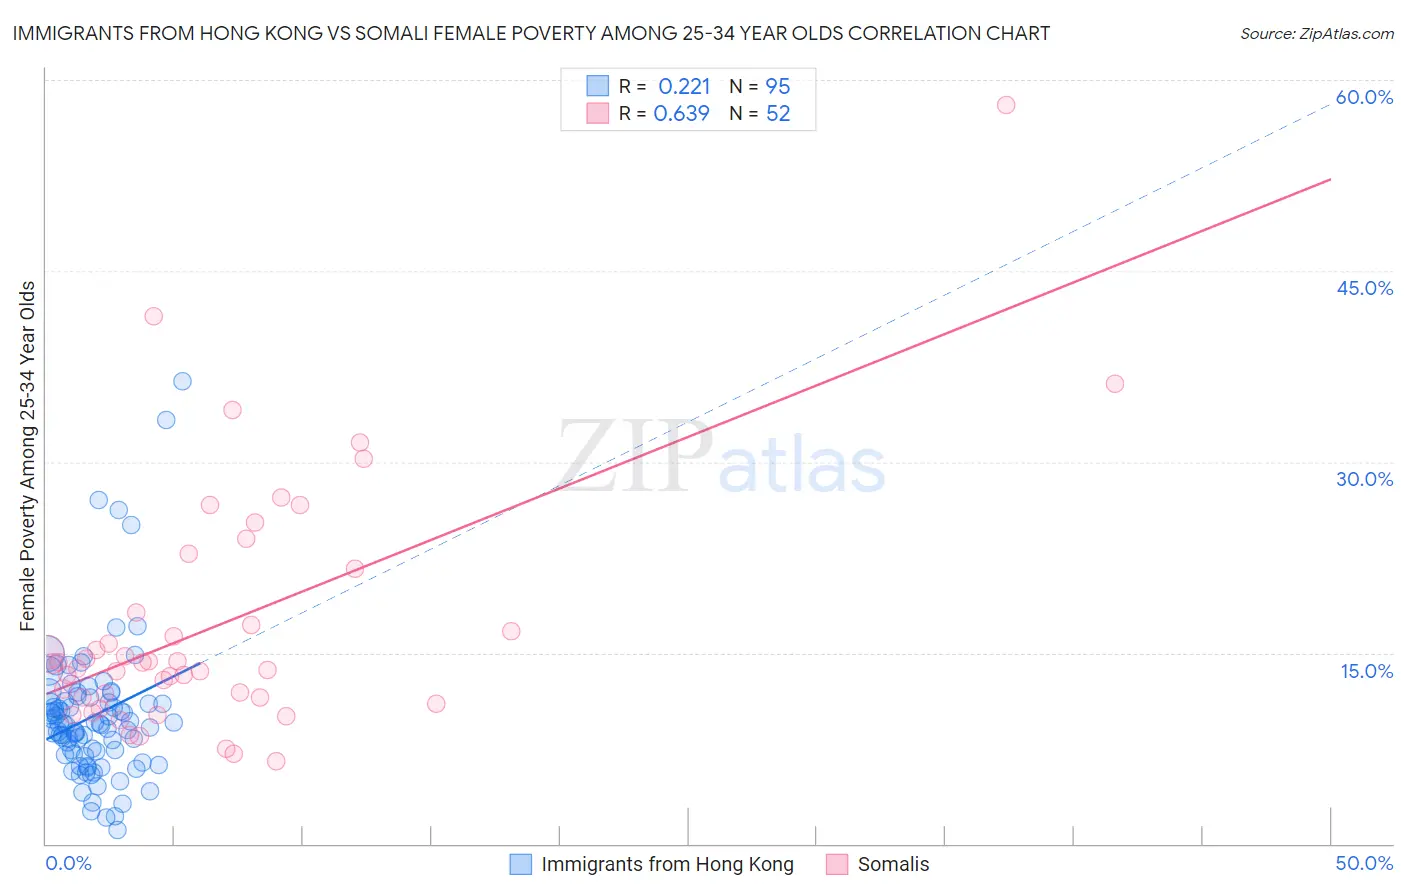
Immigrants from Hong Kong vs Somali Female Poverty Among 25-34 Year Olds Correlation Chart
The statistical analysis conducted on geographies consisting of 250,705,570 people shows a weak positive correlation between the proportion of Immigrants from Hong Kong and poverty level among females between the ages 25 and 34 in the United States with a correlation coefficient (R) of 0.221 and weighted average of 10.4%. Similarly, the statistical analysis conducted on geographies consisting of 98,871,118 people shows a significant positive correlation between the proportion of Somalis and poverty level among females between the ages 25 and 34 in the United States with a correlation coefficient (R) of 0.639 and weighted average of 15.1%, a difference of 45.5%.
Female Poverty Among 25-34 Year Olds Correlation Summary
| Measurement | Immigrants from Hong Kong | Somali |
| Minimum | 1.0% | 6.5% |
| Maximum | 36.4% | 58.1% |
| Range | 35.3% | 51.5% |
| Mean | 10.1% | 17.2% |
| Median | 9.4% | 14.2% |
| Interquartile 25% (IQ1) | 7.0% | 11.5% |
| Interquartile 75% (IQ3) | 11.2% | 19.9% |
| Interquartile Range (IQR) | 4.2% | 8.4% |
| Standard Deviation (Sample) | 5.7% | 9.7% |
| Standard Deviation (Population) | 5.7% | 9.7% |
Similar Demographics by Female Poverty Among 25-34 Year Olds
Demographics Similar to Immigrants from Hong Kong by Female Poverty Among 25-34 Year Olds
In terms of female poverty among 25-34 year olds, the demographic groups most similar to Immigrants from Hong Kong are Thai (10.2%, a difference of 1.4%), Filipino (10.2%, a difference of 1.5%), Immigrants from Taiwan (10.0%, a difference of 3.6%), Immigrants from South Central Asia (10.8%, a difference of 3.7%), and Chinese (11.0%, a difference of 5.7%).
| Demographics | Rating | Rank | Female Poverty Among 25-34 Year Olds |
| Immigrants | India | 100.0 /100 | #1 | Exceptional 9.7% |
| Immigrants | Taiwan | 100.0 /100 | #2 | Exceptional 10.0% |
| Filipinos | 100.0 /100 | #3 | Exceptional 10.2% |
| Thais | 100.0 /100 | #4 | Exceptional 10.2% |
| Immigrants | Hong Kong | 100.0 /100 | #5 | Exceptional 10.4% |
| Immigrants | South Central Asia | 100.0 /100 | #6 | Exceptional 10.8% |
| Chinese | 100.0 /100 | #7 | Exceptional 11.0% |
| Immigrants | Iran | 100.0 /100 | #8 | Exceptional 11.0% |
| Immigrants | Singapore | 100.0 /100 | #9 | Exceptional 11.1% |
| Immigrants | Lithuania | 100.0 /100 | #10 | Exceptional 11.1% |
| Immigrants | Korea | 100.0 /100 | #11 | Exceptional 11.1% |
| Immigrants | Ireland | 100.0 /100 | #12 | Exceptional 11.2% |
| Burmese | 100.0 /100 | #13 | Exceptional 11.2% |
| Indians (Asian) | 100.0 /100 | #14 | Exceptional 11.2% |
| Assyrians/Chaldeans/Syriacs | 100.0 /100 | #15 | Exceptional 11.2% |
Demographics Similar to Somalis by Female Poverty Among 25-34 Year Olds
In terms of female poverty among 25-34 year olds, the demographic groups most similar to Somalis are Immigrants from West Indies (15.1%, a difference of 0.080%), Belizean (15.1%, a difference of 0.22%), Haitian (15.0%, a difference of 0.39%), Immigrants from Laos (15.2%, a difference of 0.39%), and West Indian (15.2%, a difference of 0.55%).
| Demographics | Rating | Rank | Female Poverty Among 25-34 Year Olds |
| German Russians | 0.8 /100 | #247 | Tragic 14.9% |
| Immigrants | Western Africa | 0.8 /100 | #248 | Tragic 14.9% |
| Immigrants | Haiti | 0.5 /100 | #249 | Tragic 15.0% |
| Immigrants | El Salvador | 0.5 /100 | #250 | Tragic 15.0% |
| Haitians | 0.5 /100 | #251 | Tragic 15.0% |
| Belizeans | 0.4 /100 | #252 | Tragic 15.1% |
| Immigrants | West Indies | 0.4 /100 | #253 | Tragic 15.1% |
| Somalis | 0.4 /100 | #254 | Tragic 15.1% |
| Immigrants | Laos | 0.3 /100 | #255 | Tragic 15.2% |
| West Indians | 0.3 /100 | #256 | Tragic 15.2% |
| Immigrants | Burma/Myanmar | 0.3 /100 | #257 | Tragic 15.2% |
| Nepalese | 0.2 /100 | #258 | Tragic 15.2% |
| Immigrants | Cuba | 0.2 /100 | #259 | Tragic 15.2% |
| Marshallese | 0.2 /100 | #260 | Tragic 15.3% |
| Liberians | 0.2 /100 | #261 | Tragic 15.3% |