Immigrants from Hong Kong vs Bermudan Female Poverty Among 25-34 Year Olds
COMPARE
Immigrants from Hong Kong
Bermudan
Female Poverty Among 25-34 Year Olds
Female Poverty Among 25-34 Year Olds Comparison
Immigrants from Hong Kong
Bermudans
10.4%
FEMALE POVERTY AMONG 25-34 YEAR OLDS
100.0/ 100
METRIC RATING
5th/ 347
METRIC RANK
13.6%
FEMALE POVERTY AMONG 25-34 YEAR OLDS
46.8/ 100
METRIC RATING
175th/ 347
METRIC RANK
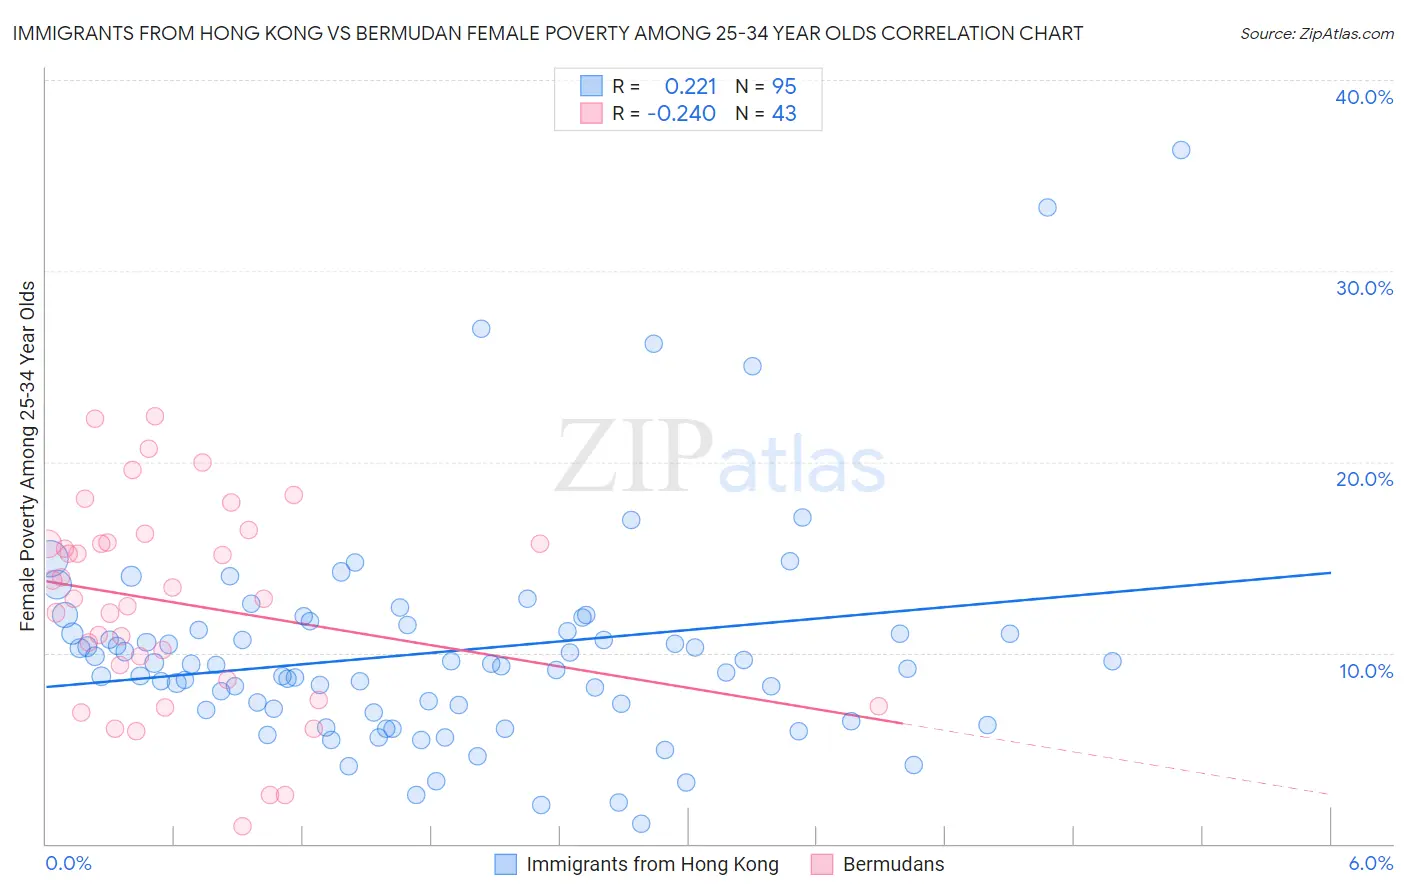
Immigrants from Hong Kong vs Bermudan Female Poverty Among 25-34 Year Olds Correlation Chart
The statistical analysis conducted on geographies consisting of 250,705,570 people shows a weak positive correlation between the proportion of Immigrants from Hong Kong and poverty level among females between the ages 25 and 34 in the United States with a correlation coefficient (R) of 0.221 and weighted average of 10.4%. Similarly, the statistical analysis conducted on geographies consisting of 55,574,742 people shows a weak negative correlation between the proportion of Bermudans and poverty level among females between the ages 25 and 34 in the United States with a correlation coefficient (R) of -0.240 and weighted average of 13.6%, a difference of 30.8%.
Female Poverty Among 25-34 Year Olds Correlation Summary
| Measurement | Immigrants from Hong Kong | Bermudan |
| Minimum | 1.0% | 0.91% |
| Maximum | 36.4% | 22.4% |
| Range | 35.3% | 21.5% |
| Mean | 10.1% | 12.6% |
| Median | 9.4% | 12.8% |
| Interquartile 25% (IQ1) | 7.0% | 8.6% |
| Interquartile 75% (IQ3) | 11.2% | 15.8% |
| Interquartile Range (IQR) | 4.2% | 7.2% |
| Standard Deviation (Sample) | 5.7% | 5.3% |
| Standard Deviation (Population) | 5.7% | 5.3% |
Similar Demographics by Female Poverty Among 25-34 Year Olds
Demographics Similar to Immigrants from Hong Kong by Female Poverty Among 25-34 Year Olds
In terms of female poverty among 25-34 year olds, the demographic groups most similar to Immigrants from Hong Kong are Thai (10.2%, a difference of 1.4%), Filipino (10.2%, a difference of 1.5%), Immigrants from Taiwan (10.0%, a difference of 3.6%), Immigrants from South Central Asia (10.8%, a difference of 3.7%), and Chinese (11.0%, a difference of 5.7%).
| Demographics | Rating | Rank | Female Poverty Among 25-34 Year Olds |
| Immigrants | India | 100.0 /100 | #1 | Exceptional 9.7% |
| Immigrants | Taiwan | 100.0 /100 | #2 | Exceptional 10.0% |
| Filipinos | 100.0 /100 | #3 | Exceptional 10.2% |
| Thais | 100.0 /100 | #4 | Exceptional 10.2% |
| Immigrants | Hong Kong | 100.0 /100 | #5 | Exceptional 10.4% |
| Immigrants | South Central Asia | 100.0 /100 | #6 | Exceptional 10.8% |
| Chinese | 100.0 /100 | #7 | Exceptional 11.0% |
| Immigrants | Iran | 100.0 /100 | #8 | Exceptional 11.0% |
| Immigrants | Singapore | 100.0 /100 | #9 | Exceptional 11.1% |
| Immigrants | Lithuania | 100.0 /100 | #10 | Exceptional 11.1% |
| Immigrants | Korea | 100.0 /100 | #11 | Exceptional 11.1% |
| Immigrants | Ireland | 100.0 /100 | #12 | Exceptional 11.2% |
| Burmese | 100.0 /100 | #13 | Exceptional 11.2% |
| Indians (Asian) | 100.0 /100 | #14 | Exceptional 11.2% |
| Assyrians/Chaldeans/Syriacs | 100.0 /100 | #15 | Exceptional 11.2% |
Demographics Similar to Bermudans by Female Poverty Among 25-34 Year Olds
In terms of female poverty among 25-34 year olds, the demographic groups most similar to Bermudans are Yugoslavian (13.6%, a difference of 0.15%), Venezuelan (13.6%, a difference of 0.18%), Canadian (13.6%, a difference of 0.21%), Immigrants from Oceania (13.5%, a difference of 0.26%), and Immigrants from Eastern Africa (13.6%, a difference of 0.27%).
| Demographics | Rating | Rank | Female Poverty Among 25-34 Year Olds |
| Immigrants | Afghanistan | 57.7 /100 | #168 | Average 13.4% |
| Samoans | 56.8 /100 | #169 | Average 13.5% |
| Immigrants | Uganda | 53.0 /100 | #170 | Average 13.5% |
| South American Indians | 51.9 /100 | #171 | Average 13.5% |
| Immigrants | Costa Rica | 51.9 /100 | #172 | Average 13.5% |
| Kenyans | 51.8 /100 | #173 | Average 13.5% |
| Immigrants | Oceania | 50.0 /100 | #174 | Average 13.5% |
| Bermudans | 46.8 /100 | #175 | Average 13.6% |
| Yugoslavians | 45.0 /100 | #176 | Average 13.6% |
| Venezuelans | 44.6 /100 | #177 | Average 13.6% |
| Canadians | 44.3 /100 | #178 | Average 13.6% |
| Immigrants | Eastern Africa | 43.6 /100 | #179 | Average 13.6% |
| Germans | 41.6 /100 | #180 | Average 13.6% |
| Guamanians/Chamorros | 41.5 /100 | #181 | Average 13.6% |
| Immigrants | Venezuela | 40.7 /100 | #182 | Average 13.6% |