Immigrants from Germany vs Somali Female Poverty Among 25-34 Year Olds
COMPARE
Immigrants from Germany
Somali
Female Poverty Among 25-34 Year Olds
Female Poverty Among 25-34 Year Olds Comparison
Immigrants from Germany
Somalis
13.9%
FEMALE POVERTY AMONG 25-34 YEAR OLDS
20.9/ 100
METRIC RATING
198th/ 347
METRIC RANK
15.1%
FEMALE POVERTY AMONG 25-34 YEAR OLDS
0.4/ 100
METRIC RATING
254th/ 347
METRIC RANK
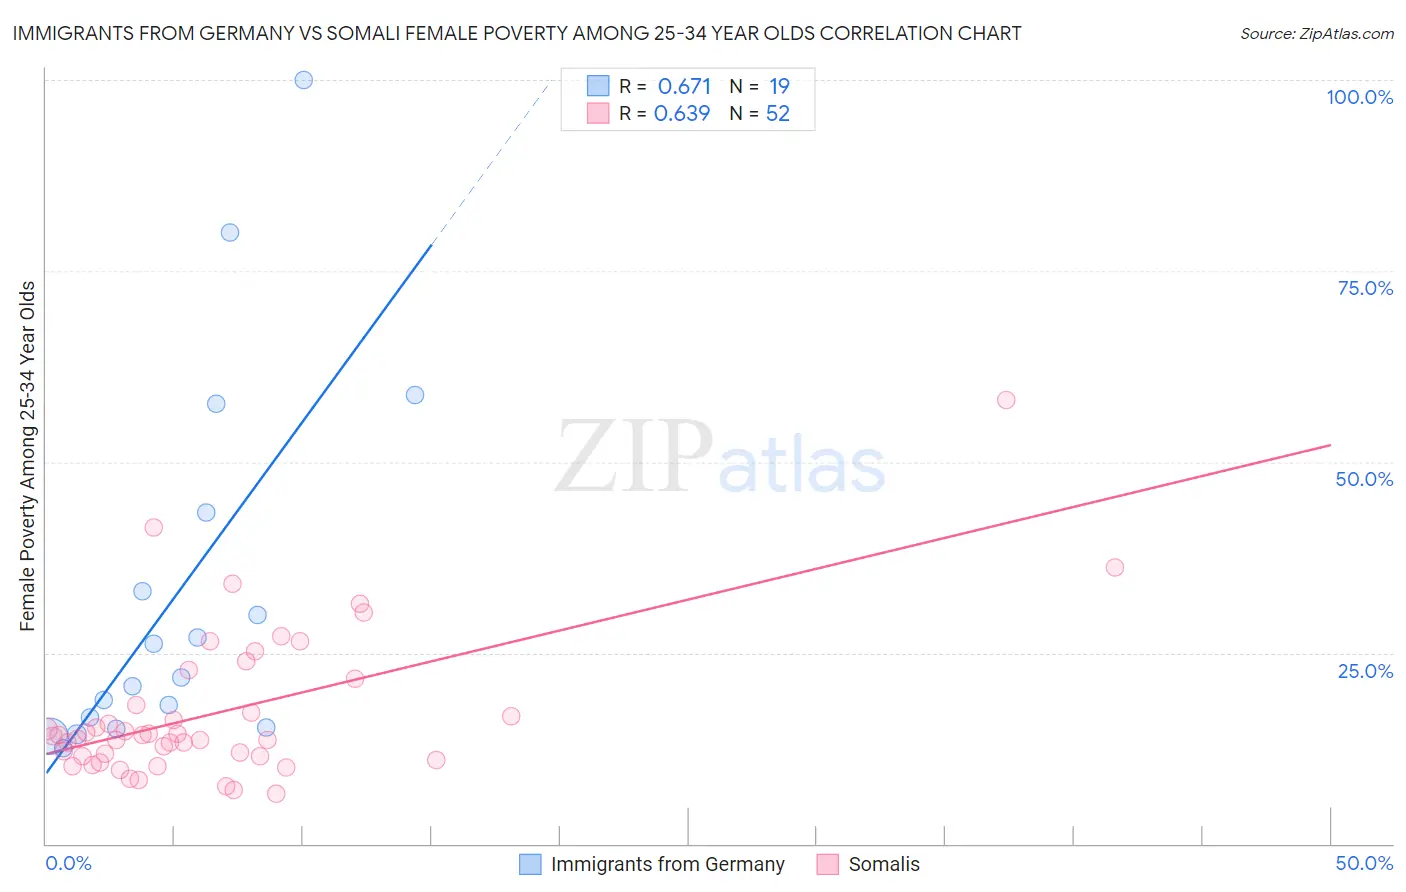
Immigrants from Germany vs Somali Female Poverty Among 25-34 Year Olds Correlation Chart
The statistical analysis conducted on geographies consisting of 453,575,395 people shows a significant positive correlation between the proportion of Immigrants from Germany and poverty level among females between the ages 25 and 34 in the United States with a correlation coefficient (R) of 0.671 and weighted average of 13.9%. Similarly, the statistical analysis conducted on geographies consisting of 98,871,118 people shows a significant positive correlation between the proportion of Somalis and poverty level among females between the ages 25 and 34 in the United States with a correlation coefficient (R) of 0.639 and weighted average of 15.1%, a difference of 8.5%.
Female Poverty Among 25-34 Year Olds Correlation Summary
| Measurement | Immigrants from Germany | Somali |
| Minimum | 12.5% | 6.5% |
| Maximum | 100.0% | 58.1% |
| Range | 87.5% | 51.5% |
| Mean | 32.8% | 17.2% |
| Median | 21.7% | 14.2% |
| Interquartile 25% (IQ1) | 15.2% | 11.5% |
| Interquartile 75% (IQ3) | 43.3% | 19.9% |
| Interquartile Range (IQR) | 28.1% | 8.4% |
| Standard Deviation (Sample) | 24.6% | 9.7% |
| Standard Deviation (Population) | 24.0% | 9.7% |
Similar Demographics by Female Poverty Among 25-34 Year Olds
Demographics Similar to Immigrants from Germany by Female Poverty Among 25-34 Year Olds
In terms of female poverty among 25-34 year olds, the demographic groups most similar to Immigrants from Germany are English (13.9%, a difference of 0.060%), Hmong (13.9%, a difference of 0.080%), Immigrants from Saudi Arabia (13.9%, a difference of 0.11%), Scottish (13.9%, a difference of 0.32%), and Immigrants from Cambodia (13.9%, a difference of 0.36%).
| Demographics | Rating | Rank | Female Poverty Among 25-34 Year Olds |
| Immigrants | St. Vincent and the Grenadines | 29.3 /100 | #191 | Fair 13.8% |
| Tlingit-Haida | 28.1 /100 | #192 | Fair 13.8% |
| Immigrants | Kenya | 28.0 /100 | #193 | Fair 13.8% |
| Moroccans | 25.1 /100 | #194 | Fair 13.8% |
| Immigrants | Cambodia | 24.0 /100 | #195 | Fair 13.9% |
| Scottish | 23.6 /100 | #196 | Fair 13.9% |
| Immigrants | Saudi Arabia | 21.9 /100 | #197 | Fair 13.9% |
| Immigrants | Germany | 20.9 /100 | #198 | Fair 13.9% |
| English | 20.4 /100 | #199 | Fair 13.9% |
| Hmong | 20.3 /100 | #200 | Fair 13.9% |
| Immigrants | Trinidad and Tobago | 17.6 /100 | #201 | Poor 14.0% |
| Welsh | 17.2 /100 | #202 | Poor 14.0% |
| Immigrants | Immigrants | 14.5 /100 | #203 | Poor 14.0% |
| Hawaiians | 13.6 /100 | #204 | Poor 14.1% |
| Immigrants | Africa | 13.4 /100 | #205 | Poor 14.1% |
Demographics Similar to Somalis by Female Poverty Among 25-34 Year Olds
In terms of female poverty among 25-34 year olds, the demographic groups most similar to Somalis are Immigrants from West Indies (15.1%, a difference of 0.080%), Belizean (15.1%, a difference of 0.22%), Haitian (15.0%, a difference of 0.39%), Immigrants from Laos (15.2%, a difference of 0.39%), and West Indian (15.2%, a difference of 0.55%).
| Demographics | Rating | Rank | Female Poverty Among 25-34 Year Olds |
| German Russians | 0.8 /100 | #247 | Tragic 14.9% |
| Immigrants | Western Africa | 0.8 /100 | #248 | Tragic 14.9% |
| Immigrants | Haiti | 0.5 /100 | #249 | Tragic 15.0% |
| Immigrants | El Salvador | 0.5 /100 | #250 | Tragic 15.0% |
| Haitians | 0.5 /100 | #251 | Tragic 15.0% |
| Belizeans | 0.4 /100 | #252 | Tragic 15.1% |
| Immigrants | West Indies | 0.4 /100 | #253 | Tragic 15.1% |
| Somalis | 0.4 /100 | #254 | Tragic 15.1% |
| Immigrants | Laos | 0.3 /100 | #255 | Tragic 15.2% |
| West Indians | 0.3 /100 | #256 | Tragic 15.2% |
| Immigrants | Burma/Myanmar | 0.3 /100 | #257 | Tragic 15.2% |
| Nepalese | 0.2 /100 | #258 | Tragic 15.2% |
| Immigrants | Cuba | 0.2 /100 | #259 | Tragic 15.2% |
| Marshallese | 0.2 /100 | #260 | Tragic 15.3% |
| Liberians | 0.2 /100 | #261 | Tragic 15.3% |