Immigrants from Guyana vs Samoan Single Female Poverty
COMPARE
Immigrants from Guyana
Samoan
Single Female Poverty
Single Female Poverty Comparison
Immigrants from Guyana
Samoans
21.0%
SINGLE FEMALE POVERTY
50.6/ 100
METRIC RATING
173rd/ 347
METRIC RANK
20.6%
SINGLE FEMALE POVERTY
76.0/ 100
METRIC RATING
155th/ 347
METRIC RANK
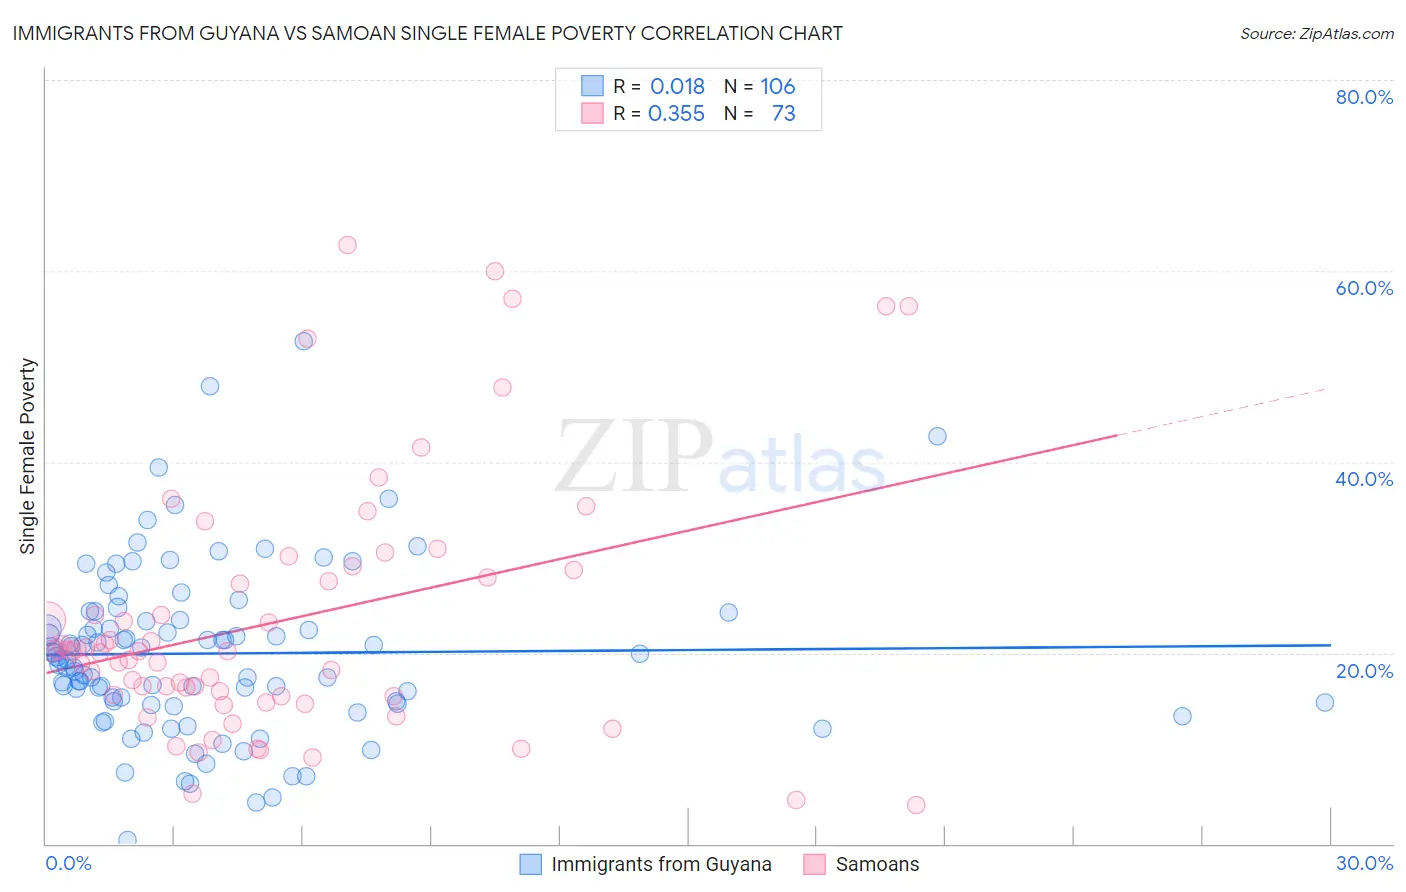
Immigrants from Guyana vs Samoan Single Female Poverty Correlation Chart
The statistical analysis conducted on geographies consisting of 182,103,781 people shows no correlation between the proportion of Immigrants from Guyana and poverty level among single females in the United States with a correlation coefficient (R) of 0.018 and weighted average of 21.0%. Similarly, the statistical analysis conducted on geographies consisting of 223,791,038 people shows a mild positive correlation between the proportion of Samoans and poverty level among single females in the United States with a correlation coefficient (R) of 0.355 and weighted average of 20.6%, a difference of 1.8%.
Single Female Poverty Correlation Summary
| Measurement | Immigrants from Guyana | Samoan |
| Minimum | 0.34% | 4.0% |
| Maximum | 52.6% | 62.7% |
| Range | 52.3% | 58.7% |
| Mean | 19.9% | 23.3% |
| Median | 19.5% | 20.1% |
| Interquartile 25% (IQ1) | 14.8% | 15.4% |
| Interquartile 75% (IQ3) | 23.4% | 28.3% |
| Interquartile Range (IQR) | 8.6% | 12.9% |
| Standard Deviation (Sample) | 8.8% | 13.3% |
| Standard Deviation (Population) | 8.8% | 13.2% |
Demographics Similar to Immigrants from Guyana and Samoans by Single Female Poverty
In terms of single female poverty, the demographic groups most similar to Immigrants from Guyana are Cuban (21.0%, a difference of 0.040%), Guyanese (21.0%, a difference of 0.090%), Moroccan (21.0%, a difference of 0.14%), New Zealander (21.0%, a difference of 0.16%), and Immigrants from Trinidad and Tobago (20.9%, a difference of 0.36%). Similarly, the demographic groups most similar to Samoans are South American Indian (20.6%, a difference of 0.030%), Immigrants from Western Europe (20.6%, a difference of 0.060%), Immigrants from Oceania (20.7%, a difference of 0.15%), Danish (20.7%, a difference of 0.26%), and Costa Rican (20.7%, a difference of 0.35%).
| Demographics | Rating | Rank | Single Female Poverty |
| Immigrants | Western Europe | 76.7 /100 | #154 | Good 20.6% |
| Samoans | 76.0 /100 | #155 | Good 20.6% |
| South American Indians | 75.7 /100 | #156 | Good 20.6% |
| Immigrants | Oceania | 74.3 /100 | #157 | Good 20.7% |
| Danes | 73.0 /100 | #158 | Good 20.7% |
| Costa Ricans | 71.8 /100 | #159 | Good 20.7% |
| Arabs | 70.8 /100 | #160 | Good 20.7% |
| Kenyans | 68.5 /100 | #161 | Good 20.8% |
| Northern Europeans | 68.4 /100 | #162 | Good 20.8% |
| Lebanese | 67.6 /100 | #163 | Good 20.8% |
| Iraqis | 64.5 /100 | #164 | Good 20.8% |
| Ugandans | 64.0 /100 | #165 | Good 20.8% |
| Norwegians | 63.0 /100 | #166 | Good 20.8% |
| Immigrants | Norway | 63.0 /100 | #167 | Good 20.8% |
| Immigrants | Costa Rica | 61.5 /100 | #168 | Good 20.9% |
| Immigrants | Trinidad and Tobago | 56.3 /100 | #169 | Average 20.9% |
| New Zealanders | 53.2 /100 | #170 | Average 21.0% |
| Moroccans | 52.8 /100 | #171 | Average 21.0% |
| Guyanese | 52.0 /100 | #172 | Average 21.0% |
| Immigrants | Guyana | 50.6 /100 | #173 | Average 21.0% |
| Cubans | 50.0 /100 | #174 | Average 21.0% |