Immigrants from Guatemala vs French American Indian Female Poverty
COMPARE
Immigrants from Guatemala
French American Indian
Female Poverty
Female Poverty Comparison
Immigrants from Guatemala
French American Indians
17.0%
FEMALE POVERTY
0.0/ 100
METRIC RATING
311th/ 347
METRIC RANK
15.1%
FEMALE POVERTY
0.6/ 100
METRIC RATING
237th/ 347
METRIC RANK
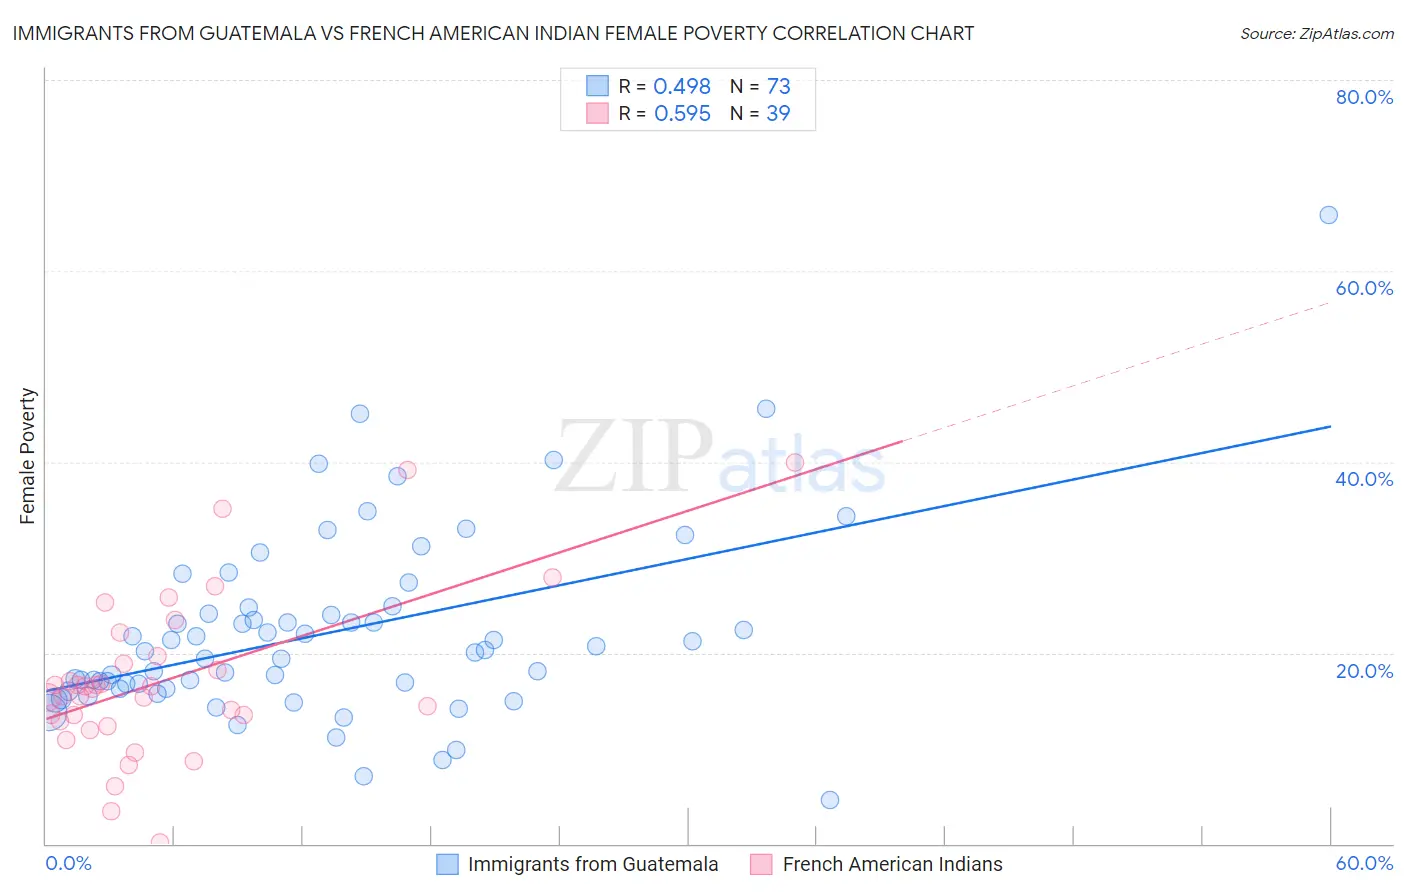
Immigrants from Guatemala vs French American Indian Female Poverty Correlation Chart
The statistical analysis conducted on geographies consisting of 377,104,369 people shows a moderate positive correlation between the proportion of Immigrants from Guatemala and poverty level among females in the United States with a correlation coefficient (R) of 0.498 and weighted average of 17.0%. Similarly, the statistical analysis conducted on geographies consisting of 131,968,938 people shows a substantial positive correlation between the proportion of French American Indians and poverty level among females in the United States with a correlation coefficient (R) of 0.595 and weighted average of 15.1%, a difference of 12.7%.
Female Poverty Correlation Summary
| Measurement | Immigrants from Guatemala | French American Indian |
| Minimum | 4.6% | 0.16% |
| Maximum | 65.8% | 40.0% |
| Range | 61.2% | 39.8% |
| Mean | 22.1% | 17.2% |
| Median | 20.2% | 16.2% |
| Interquartile 25% (IQ1) | 16.3% | 12.8% |
| Interquartile 75% (IQ3) | 24.4% | 19.6% |
| Interquartile Range (IQR) | 8.2% | 6.8% |
| Standard Deviation (Sample) | 9.8% | 8.5% |
| Standard Deviation (Population) | 9.7% | 8.4% |
Similar Demographics by Female Poverty
Demographics Similar to Immigrants from Guatemala by Female Poverty
In terms of female poverty, the demographic groups most similar to Immigrants from Guatemala are Creek (17.0%, a difference of 0.0%), Immigrants from Somalia (17.0%, a difference of 0.090%), British West Indian (17.0%, a difference of 0.17%), Immigrants from Mexico (17.0%, a difference of 0.24%), and Dutch West Indian (17.1%, a difference of 0.42%).
| Demographics | Rating | Rank | Female Poverty |
| Immigrants | Central America | 0.0 /100 | #304 | Tragic 16.8% |
| Immigrants | Grenada | 0.0 /100 | #305 | Tragic 16.8% |
| Immigrants | Caribbean | 0.0 /100 | #306 | Tragic 16.9% |
| Seminole | 0.0 /100 | #307 | Tragic 16.9% |
| Africans | 0.0 /100 | #308 | Tragic 16.9% |
| Immigrants | Mexico | 0.0 /100 | #309 | Tragic 17.0% |
| Creek | 0.0 /100 | #310 | Tragic 17.0% |
| Immigrants | Guatemala | 0.0 /100 | #311 | Tragic 17.0% |
| Immigrants | Somalia | 0.0 /100 | #312 | Tragic 17.0% |
| British West Indians | 0.0 /100 | #313 | Tragic 17.0% |
| Dutch West Indians | 0.0 /100 | #314 | Tragic 17.1% |
| U.S. Virgin Islanders | 0.0 /100 | #315 | Tragic 17.3% |
| Hondurans | 0.0 /100 | #316 | Tragic 17.4% |
| Immigrants | Congo | 0.0 /100 | #317 | Tragic 17.4% |
| Ute | 0.0 /100 | #318 | Tragic 17.5% |
Demographics Similar to French American Indians by Female Poverty
In terms of female poverty, the demographic groups most similar to French American Indians are Immigrants from Armenia (15.1%, a difference of 0.080%), Cree (15.1%, a difference of 0.19%), Immigrants from Middle Africa (15.2%, a difference of 0.59%), Sudanese (15.2%, a difference of 0.65%), and Immigrants from Laos (15.0%, a difference of 0.82%).
| Demographics | Rating | Rank | Female Poverty |
| Alaska Natives | 1.8 /100 | #230 | Tragic 14.7% |
| Nigerians | 1.7 /100 | #231 | Tragic 14.8% |
| Osage | 1.5 /100 | #232 | Tragic 14.8% |
| Immigrants | Saudi Arabia | 1.4 /100 | #233 | Tragic 14.8% |
| Fijians | 1.1 /100 | #234 | Tragic 14.9% |
| Immigrants | Laos | 0.9 /100 | #235 | Tragic 15.0% |
| Cree | 0.7 /100 | #236 | Tragic 15.1% |
| French American Indians | 0.6 /100 | #237 | Tragic 15.1% |
| Immigrants | Armenia | 0.6 /100 | #238 | Tragic 15.1% |
| Immigrants | Middle Africa | 0.5 /100 | #239 | Tragic 15.2% |
| Sudanese | 0.5 /100 | #240 | Tragic 15.2% |
| Immigrants | Sudan | 0.4 /100 | #241 | Tragic 15.2% |
| Nepalese | 0.4 /100 | #242 | Tragic 15.2% |
| Nicaraguans | 0.3 /100 | #243 | Tragic 15.3% |
| Ecuadorians | 0.3 /100 | #244 | Tragic 15.3% |