Immigrants from France vs Chickasaw Child Poverty Among Girls Under 16
COMPARE
Immigrants from France
Chickasaw
Child Poverty Among Girls Under 16
Child Poverty Among Girls Under 16 Comparison
Immigrants from France
Chickasaw
14.9%
CHILD POVERTY AMONG GIRLS UNDER 16
96.2/ 100
METRIC RATING
96th/ 347
METRIC RANK
19.6%
CHILD POVERTY AMONG GIRLS UNDER 16
0.1/ 100
METRIC RATING
262nd/ 347
METRIC RANK
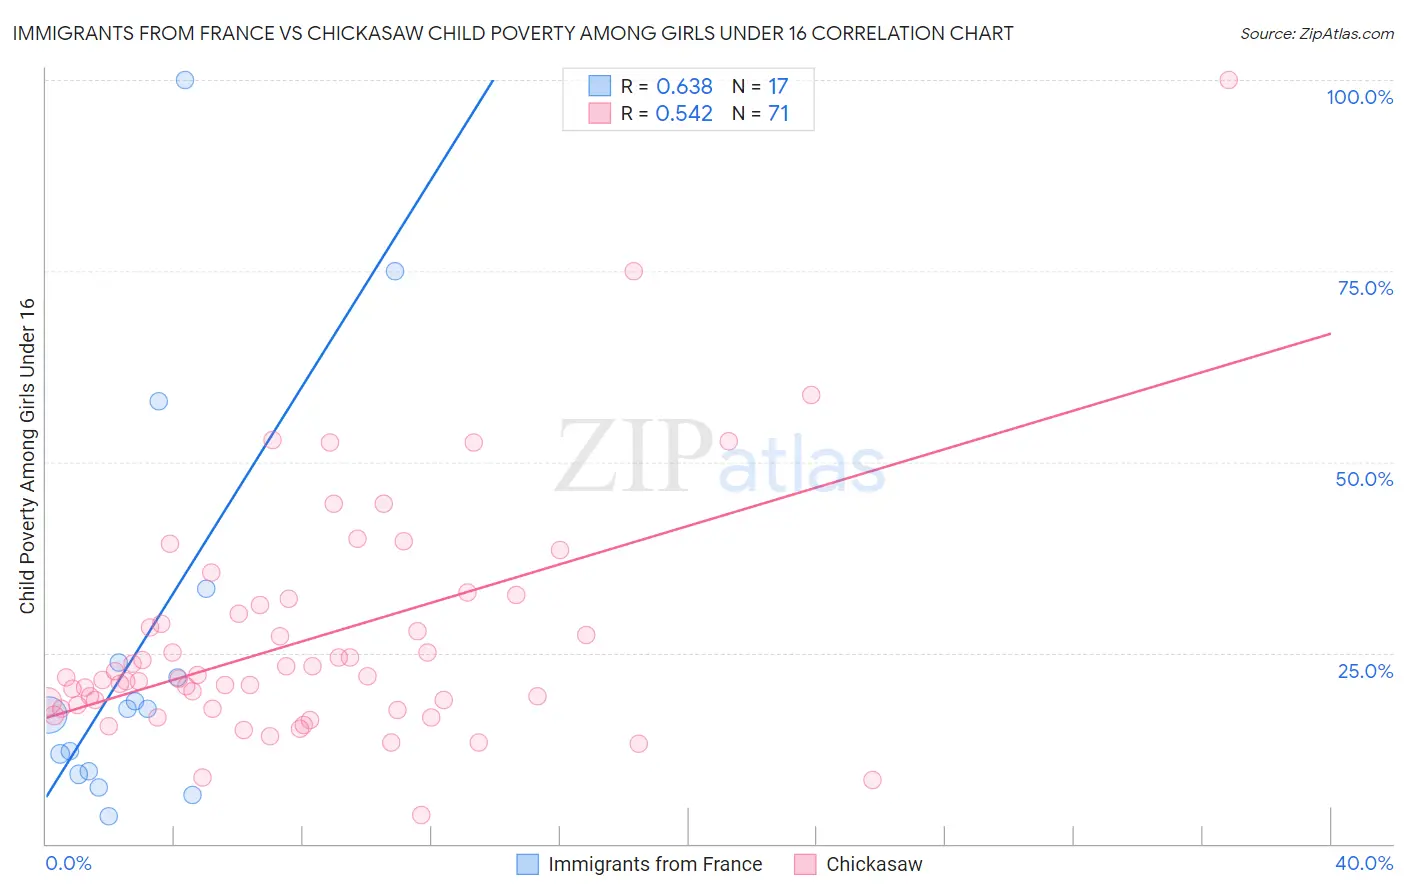
Immigrants from France vs Chickasaw Child Poverty Among Girls Under 16 Correlation Chart
The statistical analysis conducted on geographies consisting of 283,385,338 people shows a significant positive correlation between the proportion of Immigrants from France and poverty level among girls under the age of 16 in the United States with a correlation coefficient (R) of 0.638 and weighted average of 14.9%. Similarly, the statistical analysis conducted on geographies consisting of 146,952,830 people shows a substantial positive correlation between the proportion of Chickasaw and poverty level among girls under the age of 16 in the United States with a correlation coefficient (R) of 0.542 and weighted average of 19.6%, a difference of 31.4%.
Child Poverty Among Girls Under 16 Correlation Summary
| Measurement | Immigrants from France | Chickasaw |
| Minimum | 3.6% | 3.8% |
| Maximum | 100.0% | 100.0% |
| Range | 96.4% | 96.2% |
| Mean | 26.0% | 26.8% |
| Median | 17.6% | 21.7% |
| Interquartile 25% (IQ1) | 9.3% | 17.6% |
| Interquartile 75% (IQ3) | 28.5% | 31.3% |
| Interquartile Range (IQR) | 19.2% | 13.6% |
| Standard Deviation (Sample) | 26.7% | 15.5% |
| Standard Deviation (Population) | 25.9% | 15.4% |
Similar Demographics by Child Poverty Among Girls Under 16
Demographics Similar to Immigrants from France by Child Poverty Among Girls Under 16
In terms of child poverty among girls under 16, the demographic groups most similar to Immigrants from France are German (14.9%, a difference of 0.040%), Immigrants from Switzerland (14.9%, a difference of 0.070%), Immigrants from Latvia (14.9%, a difference of 0.090%), Basque (15.0%, a difference of 0.28%), and Immigrants from North America (14.9%, a difference of 0.34%).
| Demographics | Rating | Rank | Child Poverty Among Girls Under 16 |
| Jordanians | 97.1 /100 | #89 | Exceptional 14.8% |
| Northern Europeans | 97.0 /100 | #90 | Exceptional 14.8% |
| Immigrants | Belarus | 97.0 /100 | #91 | Exceptional 14.8% |
| Austrians | 96.7 /100 | #92 | Exceptional 14.9% |
| Immigrants | North America | 96.6 /100 | #93 | Exceptional 14.9% |
| Immigrants | Switzerland | 96.3 /100 | #94 | Exceptional 14.9% |
| Germans | 96.3 /100 | #95 | Exceptional 14.9% |
| Immigrants | France | 96.2 /100 | #96 | Exceptional 14.9% |
| Immigrants | Latvia | 96.1 /100 | #97 | Exceptional 14.9% |
| Basques | 95.9 /100 | #98 | Exceptional 15.0% |
| Immigrants | Egypt | 95.7 /100 | #99 | Exceptional 15.0% |
| Paraguayans | 95.7 /100 | #100 | Exceptional 15.0% |
| Immigrants | South Africa | 95.6 /100 | #101 | Exceptional 15.0% |
| Immigrants | Malaysia | 95.6 /100 | #102 | Exceptional 15.0% |
| British | 95.6 /100 | #103 | Exceptional 15.0% |
Demographics Similar to Chickasaw by Child Poverty Among Girls Under 16
In terms of child poverty among girls under 16, the demographic groups most similar to Chickasaw are Immigrants from Burma/Myanmar (19.7%, a difference of 0.12%), Jamaican (19.7%, a difference of 0.23%), Vietnamese (19.5%, a difference of 0.52%), Mexican American Indian (19.5%, a difference of 0.61%), and Immigrants from Jamaica (19.8%, a difference of 0.67%).
| Demographics | Rating | Rank | Child Poverty Among Girls Under 16 |
| Immigrants | Ecuador | 0.3 /100 | #255 | Tragic 19.3% |
| Trinidadians and Tobagonians | 0.2 /100 | #256 | Tragic 19.3% |
| Guyanese | 0.2 /100 | #257 | Tragic 19.4% |
| Salvadorans | 0.2 /100 | #258 | Tragic 19.4% |
| Ottawa | 0.2 /100 | #259 | Tragic 19.4% |
| Mexican American Indians | 0.2 /100 | #260 | Tragic 19.5% |
| Vietnamese | 0.2 /100 | #261 | Tragic 19.5% |
| Chickasaw | 0.1 /100 | #262 | Tragic 19.6% |
| Immigrants | Burma/Myanmar | 0.1 /100 | #263 | Tragic 19.7% |
| Jamaicans | 0.1 /100 | #264 | Tragic 19.7% |
| Immigrants | Jamaica | 0.1 /100 | #265 | Tragic 19.8% |
| Spanish Americans | 0.1 /100 | #266 | Tragic 19.8% |
| Immigrants | Bangladesh | 0.1 /100 | #267 | Tragic 19.9% |
| Spanish American Indians | 0.1 /100 | #268 | Tragic 19.9% |
| Liberians | 0.1 /100 | #269 | Tragic 19.9% |