Immigrants from Europe vs Immigrants from Costa Rica Child Poverty Among Girls Under 16
COMPARE
Immigrants from Europe
Immigrants from Costa Rica
Child Poverty Among Girls Under 16
Child Poverty Among Girls Under 16 Comparison
Immigrants from Europe
Immigrants from Costa Rica
14.4%
CHILD POVERTY AMONG GIRLS UNDER 16
98.7/ 100
METRIC RATING
63rd/ 347
METRIC RANK
17.0%
CHILD POVERTY AMONG GIRLS UNDER 16
25.6/ 100
METRIC RATING
195th/ 347
METRIC RANK
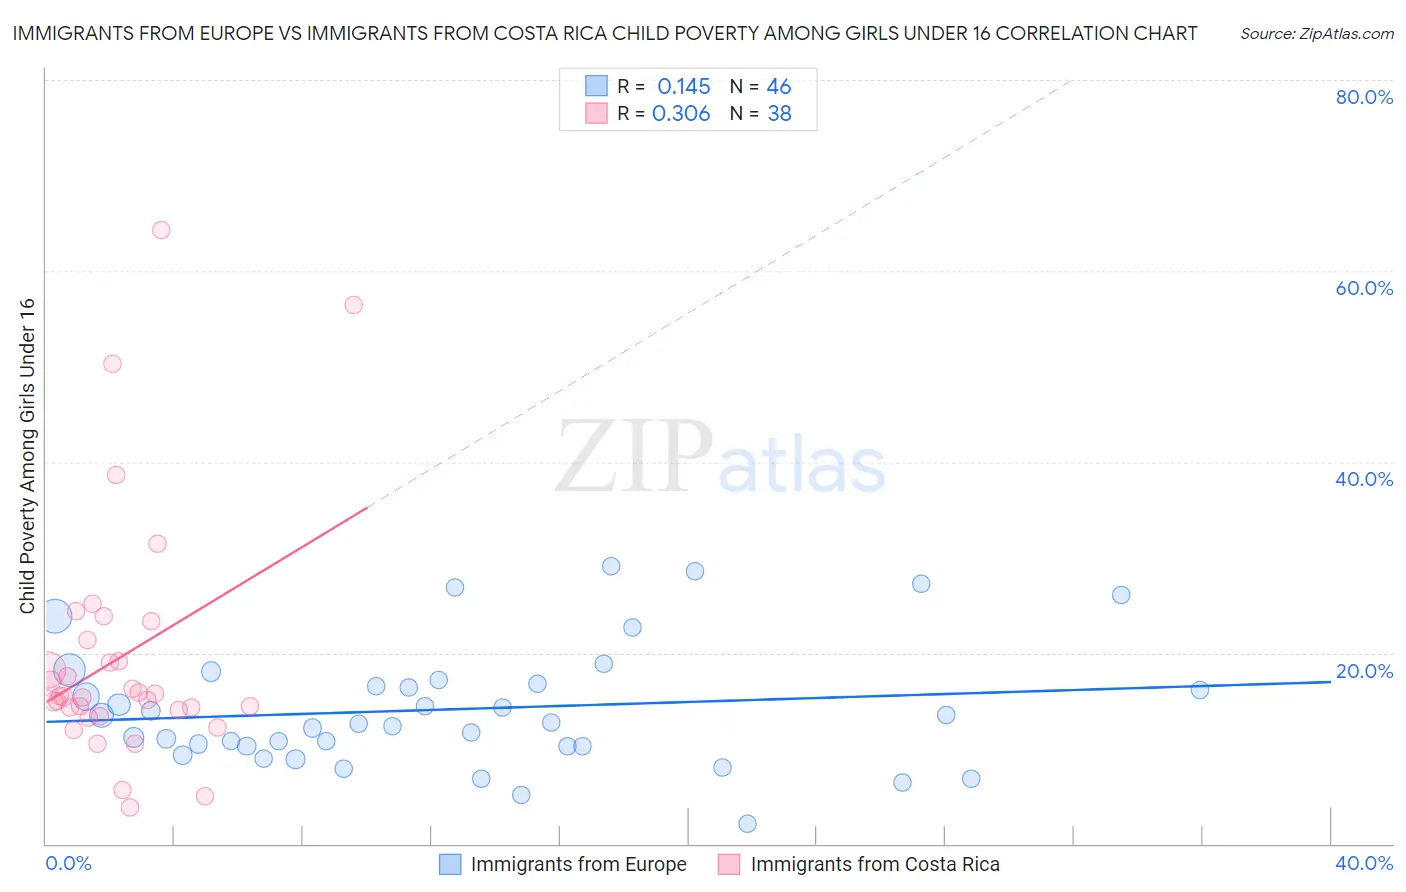
Immigrants from Europe vs Immigrants from Costa Rica Child Poverty Among Girls Under 16 Correlation Chart
The statistical analysis conducted on geographies consisting of 528,272,896 people shows a poor positive correlation between the proportion of Immigrants from Europe and poverty level among girls under the age of 16 in the United States with a correlation coefficient (R) of 0.145 and weighted average of 14.4%. Similarly, the statistical analysis conducted on geographies consisting of 202,693,762 people shows a mild positive correlation between the proportion of Immigrants from Costa Rica and poverty level among girls under the age of 16 in the United States with a correlation coefficient (R) of 0.306 and weighted average of 17.0%, a difference of 17.6%.
Child Poverty Among Girls Under 16 Correlation Summary
| Measurement | Immigrants from Europe | Immigrants from Costa Rica |
| Minimum | 2.1% | 3.7% |
| Maximum | 29.0% | 64.3% |
| Range | 26.9% | 60.5% |
| Mean | 14.1% | 19.6% |
| Median | 12.6% | 15.5% |
| Interquartile 25% (IQ1) | 10.2% | 14.1% |
| Interquartile 75% (IQ3) | 16.7% | 21.3% |
| Interquartile Range (IQR) | 6.5% | 7.2% |
| Standard Deviation (Sample) | 6.4% | 13.0% |
| Standard Deviation (Population) | 6.3% | 12.8% |
Similar Demographics by Child Poverty Among Girls Under 16
Demographics Similar to Immigrants from Europe by Child Poverty Among Girls Under 16
In terms of child poverty among girls under 16, the demographic groups most similar to Immigrants from Europe are Scandinavian (14.4%, a difference of 0.050%), Immigrants from Philippines (14.4%, a difference of 0.11%), Immigrants from Sweden (14.5%, a difference of 0.14%), Polish (14.4%, a difference of 0.16%), and Cambodian (14.4%, a difference of 0.16%).
| Demographics | Rating | Rank | Child Poverty Among Girls Under 16 |
| Immigrants | Indonesia | 98.9 /100 | #56 | Exceptional 14.4% |
| Immigrants | Serbia | 98.9 /100 | #57 | Exceptional 14.4% |
| Immigrants | Bulgaria | 98.8 /100 | #58 | Exceptional 14.4% |
| Zimbabweans | 98.8 /100 | #59 | Exceptional 14.4% |
| Poles | 98.7 /100 | #60 | Exceptional 14.4% |
| Cambodians | 98.7 /100 | #61 | Exceptional 14.4% |
| Scandinavians | 98.7 /100 | #62 | Exceptional 14.4% |
| Immigrants | Europe | 98.7 /100 | #63 | Exceptional 14.4% |
| Immigrants | Philippines | 98.6 /100 | #64 | Exceptional 14.4% |
| Immigrants | Sweden | 98.6 /100 | #65 | Exceptional 14.5% |
| Immigrants | Belgium | 98.5 /100 | #66 | Exceptional 14.5% |
| Laotians | 98.4 /100 | #67 | Exceptional 14.5% |
| Immigrants | Argentina | 98.3 /100 | #68 | Exceptional 14.6% |
| Immigrants | Poland | 98.2 /100 | #69 | Exceptional 14.6% |
| Europeans | 98.1 /100 | #70 | Exceptional 14.6% |
Demographics Similar to Immigrants from Costa Rica by Child Poverty Among Girls Under 16
In terms of child poverty among girls under 16, the demographic groups most similar to Immigrants from Costa Rica are Celtic (17.0%, a difference of 0.050%), Spaniard (17.0%, a difference of 0.11%), Spanish (16.9%, a difference of 0.43%), Aleut (16.9%, a difference of 0.44%), and Immigrants from Lebanon (17.1%, a difference of 0.46%).
| Demographics | Rating | Rank | Child Poverty Among Girls Under 16 |
| Arabs | 34.5 /100 | #188 | Fair 16.8% |
| Immigrants | Bosnia and Herzegovina | 32.5 /100 | #189 | Fair 16.8% |
| Kenyans | 32.3 /100 | #190 | Fair 16.8% |
| Immigrants | Azores | 31.3 /100 | #191 | Fair 16.8% |
| Immigrants | Uganda | 31.3 /100 | #192 | Fair 16.8% |
| Aleuts | 28.7 /100 | #193 | Fair 16.9% |
| Spanish | 28.6 /100 | #194 | Fair 16.9% |
| Immigrants | Costa Rica | 25.6 /100 | #195 | Fair 17.0% |
| Celtics | 25.2 /100 | #196 | Fair 17.0% |
| Spaniards | 24.9 /100 | #197 | Fair 17.0% |
| Immigrants | Lebanon | 22.6 /100 | #198 | Fair 17.1% |
| Immigrants | Afghanistan | 22.4 /100 | #199 | Fair 17.1% |
| Immigrants | Uzbekistan | 21.5 /100 | #200 | Fair 17.1% |
| Immigrants | Kenya | 17.8 /100 | #201 | Poor 17.2% |
| Immigrants | Sierra Leone | 17.6 /100 | #202 | Poor 17.2% |